


Fastest growing segment of maritime transport still experiences tight capacity
9.7% YOY growth in LNG carrier capacity isn’t enough
Although maritime shipping rates in containers and crude oil tankers have recovered in relative terms from the catastrophic capacity glut in 2015-6, prices still are not anywhere close to what they should be. Many maritime lines are still operating at razor-thin margins and continuing the industry-wide trend toward consolidation by acquiring their smaller, distressed competitors.
According to Stifel’s Maritime Industry Update published on March 4, one year charter rates for 9,000 TEU container ships are at $30K per day, up from the $20K trough the market experienced in August 2016, but still well below the $40K those ships were fetching per day in February 2015. The picture for crude oil tankers is even bleaker: a VLCC (very large crude carrier) from the Persian Gulf to Europe will cost you just $1,764 per day, a fraction of 2016’s average of $38,677. While dry bulk carriers are doing better, iron ore prices face downward pressure from the rapid growth in Chinese production (500M tons in 2004 to nearly 2.5B tons in 2017), which has outpaced growth in Chinese iron ore imports.
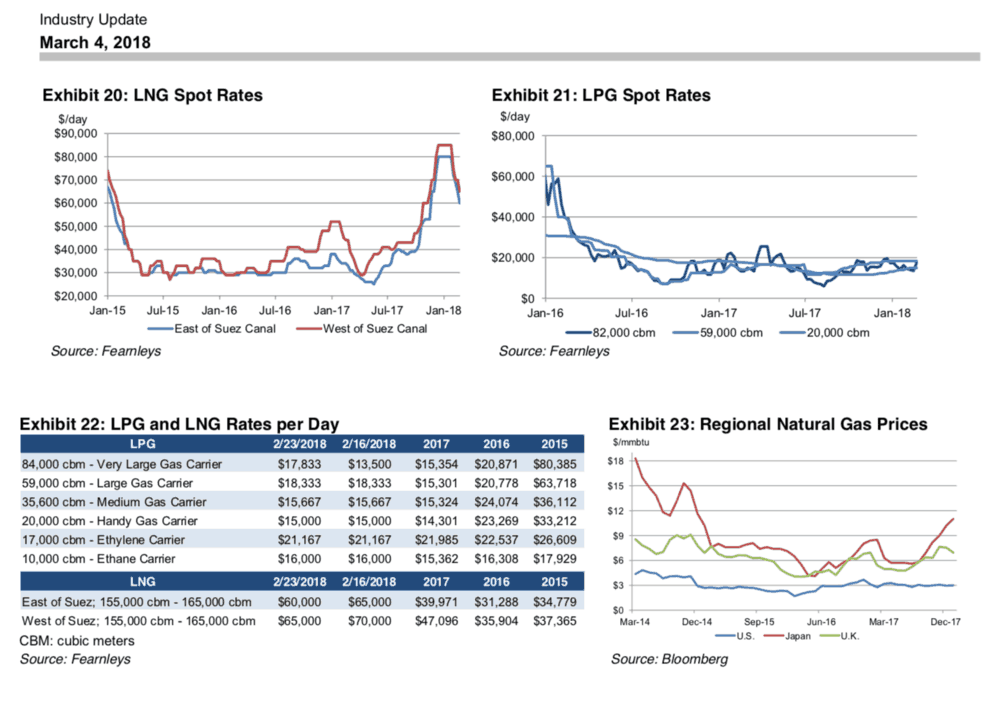
But there is a bright spot: growth in the worldwide supply of, and demand for, liquefied natural gas is outstripping the capacity needed to move it. LNG carrier rates have completely recovered from the early 2015 crash and are showing no signs of slowing down: East of Suez LNG rates averaged $34.7K per day in 2015, while West of Suez LNG rates averaged $37.3K per day in 2015. Now those rates are at $60K and $65K, respectively. What’s more, Stifel forecasts that the LNG carrier sector will experience a shortage of 68 vessels in 2018-9.
“LNG tanker operators are in a sweet spot of limited supply and growing Chinese demand,” wrote Alan Livsey in the Financial Times in December.
Three of the five top-producing natural gas fields in the United States were discovered since 2000: the Marcellus natural gas trend in PA/WV, discovered in 2008; the Haynesville Shale in LA/TX, also discovered in 2008; and the Fayetteville Shale in AR, discovered in 2005. American exports of natural gas have risen sharply since the ban on most petroleum exports was lifted in 2015: that year, the United States exported 1.78T cubic feet of natural gas; by 2016, natural gas exports reached 2.33T cubic feet; and in 2017 U.S. exported 3.16T cubic feet of gas.
Before the American oil and gas boom, many analysts expected the Atlantic petroleum trade flow from the United States to Europe to be fairly robust, but most American LNG exports are going to Mexico and Asia (by pipeline and ship, respectively). The International Energy Agency estimates that Chinese demand for LNG will grow 8.7% annually through 2022, and that Indian demand for LNG could grow up to 11% annually through 2022. Macquarie said in a Global LNG report dated December 5, 2017, that demand growth in Pakistan, Bangladesh, Thailand, Vietnam, and Sri Lanka could be even more rapid.
Much of the U.S.’s liquefied natural gas exports leave the port of Houston and transit the Panama Canal on the way to Asian shores. The Panama Canal Authority expects its 300th Neopanamax LNG tanker to transit the canal this month, typically at the rate of one vessel per day. The canal has been able to manage traffic and successfully transit 2 LNG carriers in one day on 13 separate occasions so far.
“With the rising demand and plans for US exports to increase, we need to continue to [transit 2 LNG carriers per day]. Compared to the 2017 fiscal year, we expect LNG traffic through the waterway to grow by 50% this fiscal year. This means LNG carrier transits will increase from 163 transits registered in the 2017 fiscal year to approximately 244 LNG carrier transits in the 2018 fiscal year, which ends 30 September,” said the Panama Canal Authority in a statement.
According to the United Nations’ 2017 Review of Maritime Transport, LNG/LPG carrier capacity grew 9.7% from 2016 to 2017, faster than any other segment of the global fleet (the next best growth was in oil tanker capacity, which rose 5.76%). Gas carriers also punch above their weight in terms of value: while they represent only 3% of the global fleet’s total dead weight tonnage, they account for 9.4% of the global fleet’s dollar value (ship cost plus cargo value).
Stay up-to-date with the latest commentary and insights on FreightTech and the impact to the markets by subscribing.
