On today’s episode of WHAT THE TRUCK?!? Dooner is joined by NASA Kennedy Space Center’s Brian Berry who talks about the logistics launching NASA’s next Commercial Crew mission.
Diablo Freight Ventures’ Tyson Lawrence talks about overcoming failure in freight. Lawrence went from a failed brokerage to building one that he sold to GlobalTranz. He’ll share how to pivot and when to pivot when faced with big challenges, the best environment to build and create a freight brokerage, and how to stay financially solvent in this operating environment.
F3 descends upon Chattanooga in just 12 short days. FreightWaves’ Haley Fazio is here with a preview of what’s going down at the Future of Freight Festival in the Scenic City this November.
Plus, is Flexport buying Convoy; piracy is back on the menu; truck stop buying habits; EV charging etiquette; truckers on alert with shooter on the loose; motorcyclist walks away from getting run over by a semi truck and more.
Auto inventory recovery will not be uniform — auto analytics company
The first tentative deal between the automakers and the United Auto Workers has been announced, and while inventories for new vehicles are up for the Detroit Three, not all models are up. Automotive research and auto shopper website CarGurus dove into the inventory of the Detroit automakers to look at both the models of cars that have suffered the most inventory declines and the locations around the country that are seeing a decrease in inventories.
Kevin Roberts, CarGurus’ director of industry insights and analytics, tells American Shipper the auto recovery will not be uniform since this UAW strike action was against all three automakers simultaneously and the industry is still trying to recover from reduced inventory levels caused by the semiconductor shortage.
Based on CarGurus’ research, states with the largest inventory declines for the auto models Chevy Colorado, Ford Ranger and GMC small truck Canyon were California, Florida, Texas, Michigan and Ohio.
“Inventory for midsize pickups like the Canyon are down 44%,” said Roberts. “The Chevy Colorado is down a significant 55%. The Ranger is down 45%.”
The largest inventory declines for the Ford Bronco and the Jeep Wrangler can be found in New York, Dallas-Fort Worth, Boston (Manchester, New Hampshire), Houston and Detroit.
“Vehicles impacted by the initial strike on Sept. 15 at Michigan Assembly are below their pre-strike level, with Ford Bronco inventory down 25% and the Ford Ranger down over 50%,” said Roberts.
“It’s important to note that the Ranger inventory was already down pre-strike as production was reduced due to the changeover for the all-new 2024 Ford Ranger and has been declining since May,” said Roberts. “Assuming minimal production restart hiccups, we’re likely to see Ford Bronco and Ranger inventory levels recover to their pre-strike levels in as short of time as mid-November to a long of year-end depending on sales demand.”
But on a bright note, looking at Ford’s overall inventory, new inventory has actually gone up since the start of the strike by 16%.
“So for most models there will be minimal to no inventory recovery time,” said Roberts.
Looking at Ford’s production post-strike, Roberts added that production will take time to work back up to full speed, but if history is any guide, the markets can look to the General Motors strike in 2019.
“It appears that production levels in 2019 largely normalized in November after the strike ended in late October, suggesting that we could see production levels ramp up quickly assuming there are no issues with ratification or with impacts to the supply chain,” said Roberts.
So far the decline in new inventory levels hasn’t significantly impacted pricing, according to CarGurus. Roberts explained that could be a result of consumers purchasing lower-priced inventory, which would impact the weighted average.
Echo Global Logistics goes beyond AI to drive value
The trucking industry is increasingly leveraging sophisticated new technology solutions to tackle some of its most pressing challenges.
Echo Global Logistics, a top provider of technology-enabled supply chain management services, rejects a one-size-fits-all approach to technology. It leverages a variety of intelligence capabilities to provide shippers and carriers with solutions that meet them where they are in their technology adoption journeys.
Echo provides larger shippers or carriers dealing with a high volume of shipments with access to a full suite of API and EDI integration capabilities that directly connect with their internal systems. Zach Jecklin, CIO at Echo Global Logistics, said Echo integrates with just about every TMS or enterprise resource planning system that’s out there, allowing businesses to integrate quoting, booking, tracking, document retrieval, invoicing and settlement capabilities directly to their core systems.
The industry continues to remain volatile, and accurate pricing prediction has become an integral way for businesses to budget and forecast. Echo leverages data science to confidently predict prices, which shippers and carriers can take advantage of across its platforms and technologies.
For small or midsize companies, Echo’s EchoShip platform gives them the ability to quote, book and track orders all from an industry leading front end for LTL and truckload shipping. Soon, this will include partial shipments as well. The pricing provided on EchoShip is driven by the advanced cost predicting algorithms that use this data science.
For carriers, the predicted pricing gives Echo the ability to provide access to their freight for carriers to bid and negotiate in an automated way directly through the portals.
Technology is only one side of the equation for how Echo handles over 16,000 shipments per day across its large network of shippers and carriers. Intelligent people are the other essential part, as Echo employees help solve transportation issues on behalf of clients and carriers. This leads to strong relationships between Echo and the shipper and carrier community.
“We still very much rely on people in those areas because we feel that’s the most value-added work that a person can do. All of the day-to-day mundane tasks — that’s where we put the RPA, AI, machine learning [and] the data science to work to automate those tasks so the people can do the things that really matter,” Jecklin said.
Upcoming shows feature experts on Amazon and intermodal
Amazon Marketplace: Selling there profitably is possible but not easy
(Courtesy: Cartograph)
On Monday’s The Stockout show, I will interview Chris Moe, CEO of Cartograph, a company that helps brands grow profitably on Amazon and Instacart. The numerous and interconnected challenges associated with selling on Amazon Marketplace (i.e., the 60% of Amazon revenue that involves third parties selling their own inventory) were highlighted in last month’s legal complaint brought by the Federal Trade Commission (FTC) and 17 attorneys general.
In the lawsuit, the plaintiffs allege that Amazon is abusing its monopoly position by forcing sellers to limit discounts on competing online superstores while also requiring sellers to buy advertising on Amazon in order to win the “buy box.” In addition, the FTC finds Amazon’s practice of requiring sellers to use its own fulfillment services in order to qualify for Amazon Prime to be an abuse of a monopoly position.
With those challenges as background, Moe has plenty of ideas for sellers hoping to make a buck on Amazon. He advises that sellers craft their products starting upstream — with product designs and packaging sizes that lend themselves to profitable e-commerce. For consumables, that often involves larger product sizes — a grocery item that retails for $3-$5 may have to be expanded into a variety pack to sell for $15-$20. It’s also critical for products that fit into Amazon’s standard box sizes.
Remarkably, through those and other strategies, over 90% of sellers that Cartograph advises are profitable on Amazon Marketplace. Moe believes that to sell adequate volume on Amazon, sellers need to win the “Prime badge,” since Prime customers buy four times as much as non-Prime customers (~$2,000 per year versus ~$500 per year), and that may require using Amazon’s own fulfillment services. Fortunately for sellers, Amazon tends to price freight rates fairly, according to Moe.
The show will air on FreightWaves.com at 2 p.m. EDT Monday and will be available on the FreightWaves YouTube channel and podcasting services thereafter.
Largest chassis leasing company sees intermodal growth ahead
Following up on Joanna Marsh’s article, I will interview TRAC Intermodal President and CEO Dan Walsh on Tuesday on FreightWaves’ People Speaking Rail show. The show will air at 2 p.m. EDT on FreightWaves.com.
Shippers will be relieved to hear that Walsh does not expect disruptions in chassis availability similar to those the industry experienced in 2021. At that time, chassis availability was constrained due to a combination of extraordinary events, some related to COVID and others related to the tariffs that suppressed the production of new chassis. With those issues in the rearview mirror, and recent investments in intermodal terminals and equipment, Walsh expects meaningful intermodal growth next year. He highlights recent data and expectations from the National Retail Federation, which shows continued growth in retail spending in the face of inflationary pressure on consumers. While intermodal traffic has picked up seasonally in October, Walsh considers that to be a “blip” rather than a surge and he sees few, if any, capacity constraints currently in carriers’ intermodal networks.
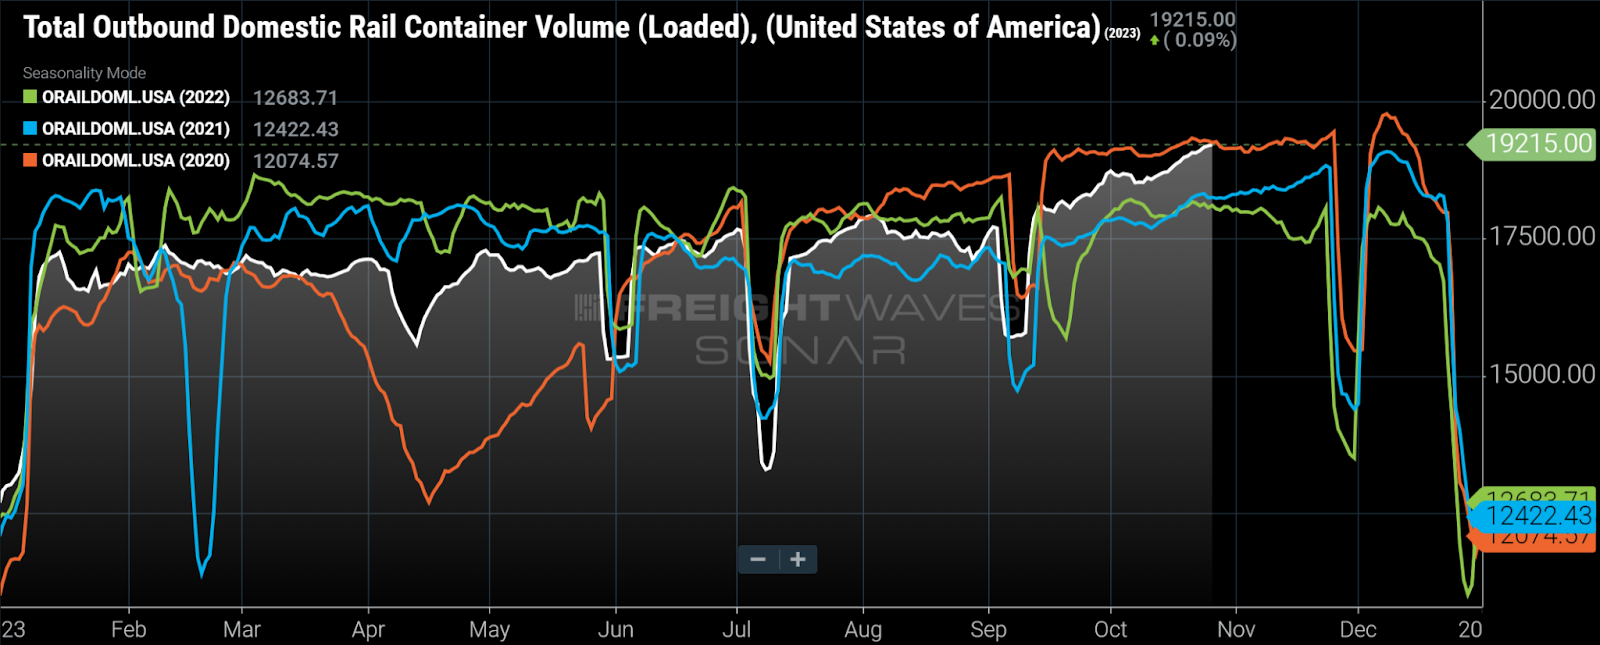
Domestic rail intermodal volume has picked up in October. (Chart: SONAR – ORAILDOML.USA)
Domestic intermodal volume rises as value proposition improves
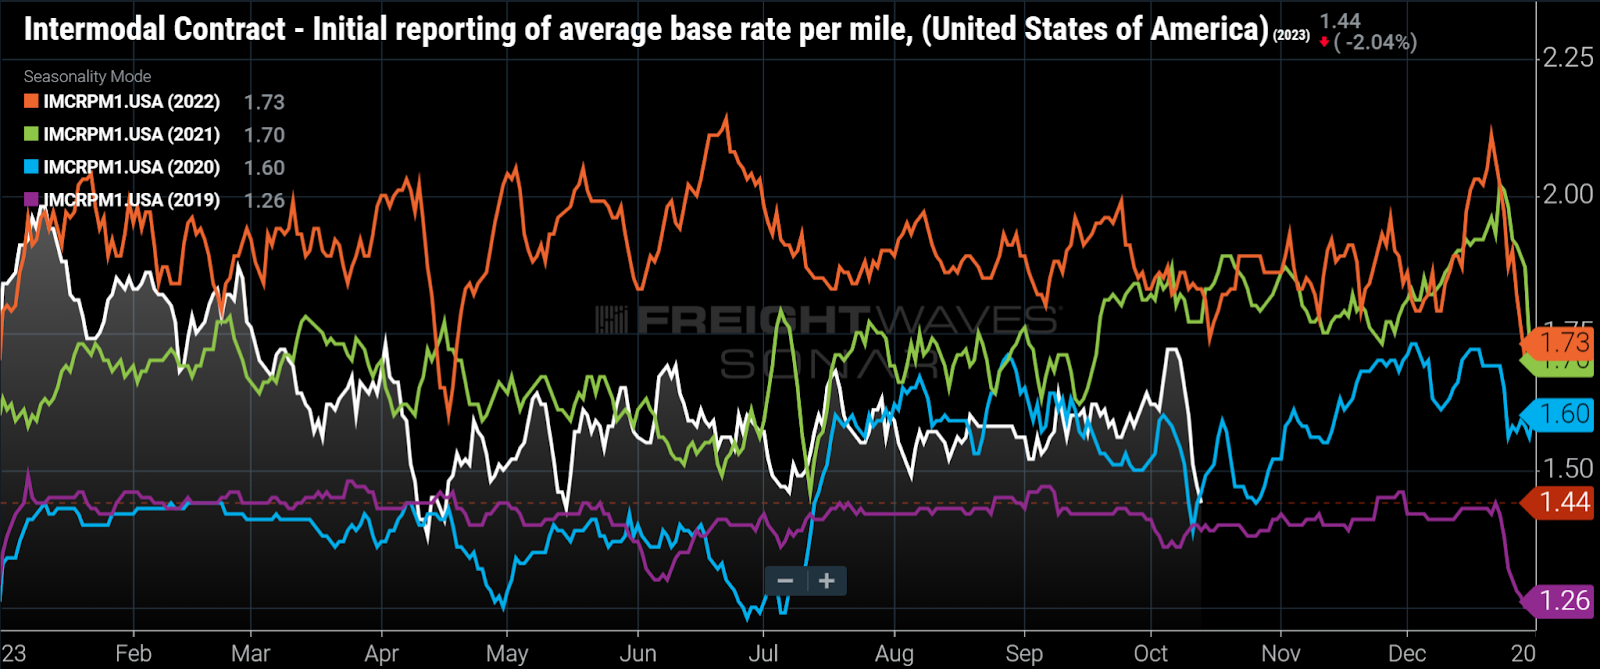
(Chart: SONAR – IMCRPM1.USA)
Due to improvements in rail service and falling rates, the value proposition of rail intermodal has improved for shippers. The service data collected by the U.S. Surface Transportation Board shows that the weekly average number of intermodal cars that have not moved in at least 48 hours is favorably down across the board on the Class I railroads. Meanwhile, the SONAR chart above highlights falling contractual rates — which were down 17% year over year (y/y) in Q3, excluding fuel surcharges. Those metrics, combined with the favorable impact of seasonality, are contributing to a strong start to the fourth quarter for loaded domestic containerized intermodal volume — which is up 4.2% y/y in the first 26 days of October. That compares favorably to a 1% y/y increase in long-haul (more than 800 miles) tender volume during the same period.
To subscribe to The Stockout, FreightWaves’ CPG and retail newsletter, click here.
Pumping the brakes
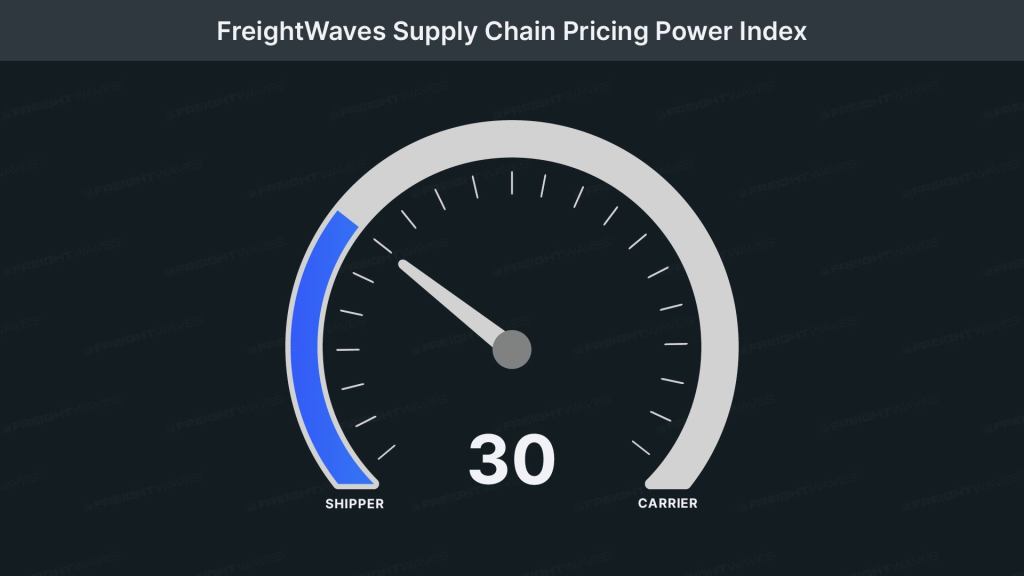
This week’s FreightWaves Supply Chain Pricing Power Index: 30 (Shippers)
Last week’s FreightWaves Supply Chain Pricing Power Index:35 (Shippers)
Three-month FreightWaves Supply Chain Pricing Power Index Outlook: 35 (Shippers)
The FreightWaves Supply Chain Pricing Power Index uses the analytics and data in FreightWavesSONAR to analyze the market and estimate the negotiating power for rates between shippers and carriers.
This week’s Pricing Power Index is based on the following indicators:
Flimsy durables
Observant readers of this column might note that while the PPI did slide down to 30 this week, the three-month outlook remains unchanged at 35. This difference is not the result of some tidal wave of freight volume about to wash up on the market, as discussed last week. Rather, the upcoming months are littered with major holidays during which carriers can (and typically do) leverage seasonal constraints on capacity for higher spot rates.
Tender volumes are below year-ago levels: SONAR: OTVI.USA: 2023 (white), 2022 (blue) and 2021 (green) To learn more about FreightWaves SONAR,click here.
This week, the Outbound Tender Volume Index (OTVI), which measures national freight demand by shippers’ requests for capacity, is up 1.43% week over week (w/w). On a year-over-year (y/y) basis, OTVI is down 4.12%, though such y/y comparisons can be colored by significant shifts in tender rejections. OTVI, which includes both accepted and rejected tenders, can be inflated by an uptick in the Outbound Tender Reject Index (OTRI).
Accepted volumes are outpaced by 2021 and ’22: SONAR: CLAV.USA: 2023 (white), 2022 (blue) and 2021 (green) To learn more about FreightWaves SONAR,click here.
Contract Load Accepted Volume (CLAV) is an index that measures accepted load volumes moving under contracted agreements. In short, it is similar to OTVI but without the rejected tenders. Looking at accepted tender volumes, we see a rise of 0.7% w/w as well as a fall of 2.64% y/y. This narrowing y/y difference implies that actual freight flow is still recovering from this cycle’s bottom.
Earlier this week, the Bureau of Economic Analysis released gross domestic product data from the third quarter. Per the BEA’s advance estimate, GDP increased 4.9% annualized in Q3 — appreciably higher than consensus estimates of 4.5% growth, though slightly below some high-end whisper numbers of 5.5%. The primary driver of Q3’s gains was personal consumption expenditures; spending on services and goods contributed a roughly equal amount to overall GDP growth.
Personal goods consumption skyrocketed from an annualized 0.5% in Q2 to 4.8% in Q3. The majority of this meteoric rise was attributed to spending on durable goods — specifically on recreational goods such as televisions, computers and music — which rose from a 0.3% annualized drop in Q2 to a staggering 7.6% gain in Q3. For freight markets, this durable goods spending is a double-edged sword since, as the name implies, such goods are built to last and are thus purchased infrequently.
Moreover, the depth of this spending in Q3 bodes poorly for consumer activity in the near future. Per data from the Federal Reserve, the total amount of revolving credit — which includes credit card debt — rose a massive 13.9% annualized in August. Given strong retail sales data from September as well as major sales events in October, this upward trend is likely to persist for the time being. Of course, it is also growing more expensive to hold such debt, as the average interest rate on a credit card plan is now an eye-watering 21.2%.
Midsize markets see healthy weekly performances: SONAR: Outbound Tender Volume Index – Weekly Change (OTVIW). To learn more about FreightWaves SONAR, click here.
Of the 135 total markets, 66 reported weekly increases in tender volumes, with most of the gains relegated to midsize markets.
Heartache and congestion
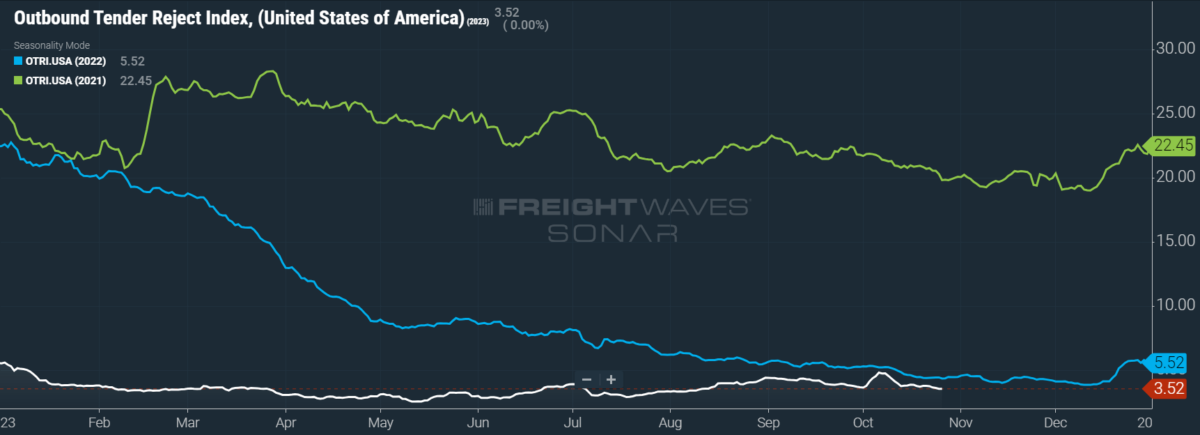
It is becoming increasingly difficult to look at tender rejections without feeling some disappointment. OTRI has dipped below its Q3 average of 3.67%, losing all gains realized since mid-August. While this column focuses on the weekly movements of key metrics, it is important to stress that OTRI’s movements from 3% to 4% do not reflect major changes in freight markets. Rather, these numbers point to the direction and rate of change in the market’s momentum.
OTRI’s recent gains are quickly lost: SONAR: OTRI.USA: 2023 (white), 2022 (blue) and 2021 (green) To learn more about FreightWaves SONAR, click here.
Over the past week, OTRI, which measures relative capacity in the market, fell to 3.52%, a change of 17 basis points from the week prior. OTRI is now 81 bps below year-ago levels, with y/y comparisons becoming more favorable even if OTRI just remains more or less stable.
A new study conducted by the American Transportation Research Institute reports that, in 2021, congestion on the roads cost trucking companies a record $94.6 billion. Though often a drain on carriers’ margins, running up tabs for driver compensation and fuel consumption, congestion can be a boon to truckers in favorable markets. Markets prone to congestion — such as Nevada, California, Georgia and Louisiana — can be tighter than others and therefore spun into profitable lanes. While congestion impacts carriers differently based on size and regions of operations, the study found that the average cost per truck was $6,824 annually. With any luck, at least some of the $184.5 billion allocated to over-the-road infrastructure improvements by the 2021 Infrastructure Investment and Jobs Act will go toward alleviating congestion.
Capacity remained broadly loose this week: SONAR: WRI (color) To learn more about FreightWaves SONAR, click here.
The map above shows the Weighted Rejection Index (WRI), the product of the Outbound Tender Reject Index – Weekly Change and Outbound Tender Market Share, as a way to prioritize rejection rate changes. As capacity is generally finding freight this week, no regions posted blue markets, which are usually the ones to focus on.
Of the 135 markets, 59 reported higher rejection rates over the past week, though 38 of those saw increases of only 100 or fewer bps.
Cooling oil markets temper fuel costs
Three weeks after the outbreak of war in the Middle East, oil prices’ rally has fizzled out despite strengthening fundamentals. Part of this failure to reach $100-a-barrel oil stems from economic headwinds continuing to send recessionary shivers down traders’ spines. But the costs of transporting oil have also risen amid the geopolitical uncertainties, dampening demand further. Despite its regional entanglements, Saudi Arabia has proven to be a mostly rational actor with regard to its oil production. While Saudi Arabia (and thus OPEC) appears to be ready to add supply back to the market if prices get too hot, the current price stagnation will incentivize them to continue their production cuts until 2024 at least.
Spot rates slide back into contraction: SONAR: National Truckload Index, 7-day average (white; right axis) and dry van contract rate (green; left axis). To learn more about FreightWaves SONAR, click here.
This week, the National Truckload Index (NTI) — which includes fuel surcharges and other accessorials — fell 2 cents per mile to $2.22. Sliding linehaul rates were wholly responsible for this decline, as the linehaul variant of the NTI (NTIL) — which excludes fuel surcharges and other accessorials — fell 3 cents per mile w/w to $1.52.
Contract rates, which are reported on a two-week delay, have recovered from a brief dip and returned to Q3’s average. Bid season is still underway and will be until March or April 2024, so shippers have yet to bring contract rates into balance with supply. The spread between linehaul spot rates and contract rates — which exclude fuel surcharges and other accessorials like the NTIL — remains abnormally wide, so shippers do have plenty of pricing power left to flex. That said, they might decide that securing long-term capacity is more important than short-term profits, keeping rates high during the market’s recovery. For the time being, contract rates are up 2 cents per mile w/w to $2.37.
SONAR: RATES.USA To learn more about FreightWaves SONAR, click here.
The chart above shows the spread between the NTIL and dry van contract rates, revealing the index has fallen to all-time lows in the data set, which dates to early 2019. Throughout that year, contract rates exceeded spot rates, leading to a record number of bankruptcies in the space. Once COVID-19 spread, spot rates reacted quickly, rising to record highs seemingly weekly, while contract rates slowly crept higher throughout 2021.
Despite this spread narrowing significantly early in the year, tightening by 20 cents per mile in January, it has remained wide throughout most of the year to date. As linehaul spot rates remain 80 cents below contract rates, there is plenty of room for contract rates to decline — or for spot rates to rise — in the final quarter of the year.
SONAR: FreightWaves TRAC rate from Los Angeles to Dallas. To learn more about FreightWaves TRAC, click here.
The FreightWaves Trusted Rate Assessment Consortium (TRAC) spot rate from Los Angeles to Dallas, arguably one of the densest freight lanes in the country, is still securing its footing. Over the past week, the TRAC rate was left unchanged at $2.31 per mile — still some distance from its year-to-date high of $2.39. The daily NTI (NTID), which has fallen to $2.21, is finally being outpaced by rates along this lane.
SONAR: FreightWaves TRAC rate from Atlanta to Philadelphia. To learn more about FreightWaves TRAC, click here.
On the East Coast, especially out of Atlanta, rates have come down from the summer’s peak but are still outpacing the NTID. The FreightWaves TRAC rate from Atlanta to Philadelphia fell 4 cents per mile to $2.25. After a bull run that started at the end of April, this lane had been plateauing above the national average, which made north-to-south lanes in the East more attractive than West Coast alternatives.
‘Fraud, theft and abuse’ force Texas freight brokerage to shut down
After 26 years in the transportation industry, with the past 12 years at the helm of the logistics company he founded and bootstrapped in 2011, Dennis Martin says he is winding down operations.
In an exclusive interview with FreightWaves, Martin, CEO of SEL Supply Chain Solutions (SELSCS) of Fort Worth, Texas, said his year started off with a $700,000 load of video poker machines being stolen in Las Vegas and “everything went downhill from there.”
“I would describe this year as being the year of fraud, theft and abuse, starting out with that $700,000 load stolen, then insurance goes up and costs go up,” Martin said. “After a solid year in 2022, where we generated $64 million in gross revenue, we lost 40% of our business this year for whatever reason.”
The death knell for his freight brokerage was when Martin’s bank started placing restrictions that limited the company’s access to capital on a daily basis.
“Our bank kept moving the goalposts on a daily basis,” Martin told FreightWaves. “We were unable to come to an agreement with our bank on our day-to-day cash flow needs for various reasons.”
At its peak, Martin said, 125 people, including 45 independent freight agents and a back-office support team in Honduras, were involved in the daily operations of SELSCS.
This week, Martin and his team are winding down the company and working with the bank to make sure that they get all the receivables they have pledged to cover and to work with the bank to hopefully pay carriers.
“I hate this for the carriers and their families for what they are going through this year with a major drop in rates and freight volumes,” he said. “Our hope is to get them paid.”
He’s also working with another logistics company to hire his independent agents and other staff. Martin also plans to sell the company’s headquarters in Fort Worth to again try and pay carriers that are owed money for hauling loads for SELSCS.
“Every year in this business has been challenging but without a doubt this has been the most challenging year I’ve had with everything that we faced with double brokering fraud, stealing loads, stealing carriers’ identities,” Martin said. “I’ve had my rate confirmations falsified and sent out to carriers and then I get carriers calling me looking for money and I’m like, ‘Well, you didn’t haul one of my loads, you were defrauded.’”
Martin originally founded Smith Eagle Logistics but rebranded the company to SELSCS in March 2022. The company provided third-party logistics services for refrigerated, dry van and flatbed freight throughout the United States and Mexico. Some of his major accounts included Home Depot, Kraft Heinz and Mike’s Hard Lemonade.
“It’s a cyclical business and I did everything that I needed to do to keep the company afloat because the last thing I wanted to do was close, but there’s just some forces out there in the market that not everybody’s gonna survive,” Martin said. “I’ve been doing this for 26 years and no one day has ever been easy in this industry.”
Do you have a news tip or story to share? Send me an email or message me @cage_writer on X, formerly known as Twitter. Your name will not be used without your permission.
Hitting the reset button: Why the industrial development pause is a good thing
By Craig Hurvitz
The views expressed here are solely those of the author and do not necessarily represent the views of FreightWaves or its affiliates.
Recent data showing a dramatic decline in warehouse construction starts has some in the sector worrying about a lack of first-generation industrial space due to limited development activity.
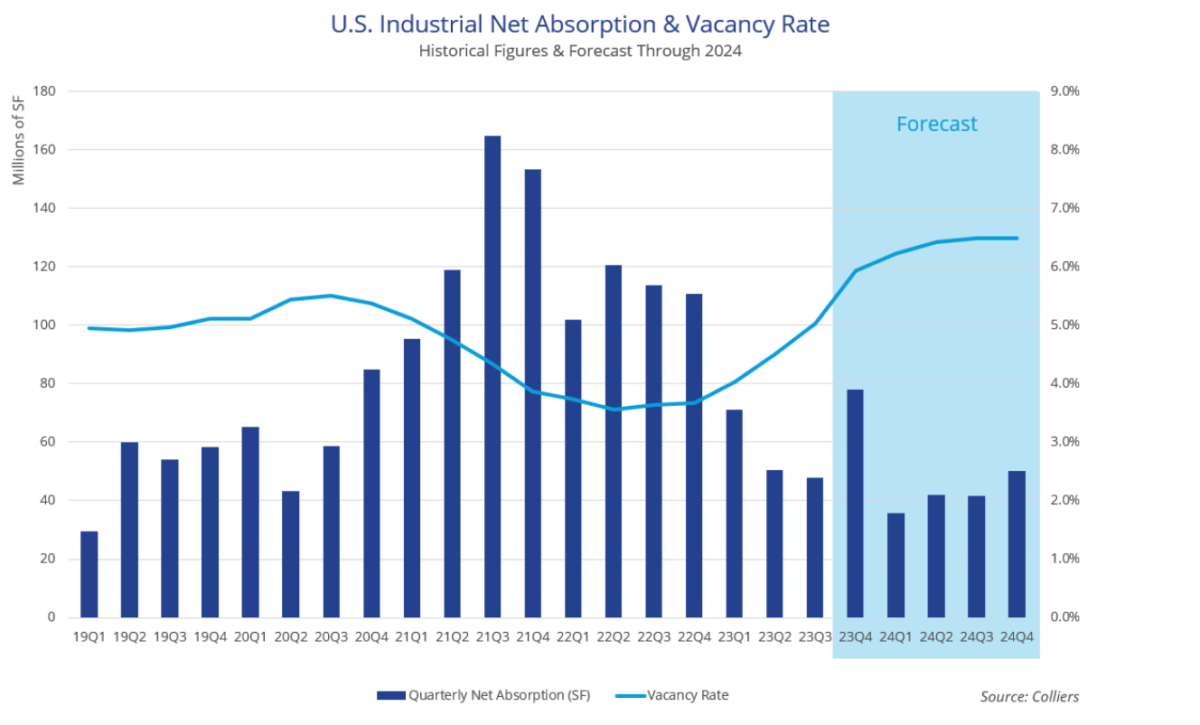
Indeed, the slowdown is noticeable. Total space under construction peaked at 638 million square feet in mid-2023 before falling 17% to 546 million square feet during the third quarter. Completions are projected to peak during the fourth quarter at 180 million square feet, but are forecast to decline by an astounding 71% by the final quarter of 2024 to only 53 million square feet.
However, this will not be bearish for the booming sector’s prospects. On the contrary, the pause in development expected in 2024 is likely just what the doctor ordered.
The drop in construction starts is indicative of a healthy market responding quickly and appropriately to slowing demand and higher costs of capital. While vacancy is climbing due to record new supply hitting the market this year and next, it’s forecast to climb to only 6.5% by 2024. That is considered a functional and balanced vacancy rate where industrial users have multiple options to choose from yet the market isn’t oversupplied.
Demand for industrial space isn’t expected to return to the frenzied pace of 2021 or 2022. But it is forecast to remain robust when compared to historical cycles. This is due to continued growth of e-commerce, third-party logistics provider requirements, manufacturing onshoring, cold storage expansion and data center needs.
Typically, this imbalance between supply and demand would be cause for concern throughout the industrial sector, but a quickly contracting construction pipeline combined with a bullish forecast for demand suggests any imbalance will be short-lived and may even be good news for industrial occupiers.
In the near term, the influx of new construction product will provide industrial occupiers with more options to occupy than they have had since before the pandemic. If industrial construction were to continue unabated, some markets and submarkets would see skyrocketing vacancy rates as supply outstripped demand. Instead, balance is likely to return quickly and vacancy rates will stabilize at functionally healthy levels before beginning to fall again.
As the construction pipeline contracts over the coming 18 months, developers will be able to gauge demand for the new product being delivered and determine the best timing to begin the next wave of industrial development.
Understanding where we are today means recalling what we’ve recently been through. Over the past two years, warehouse and distribution sites were built at a pace the market could not have fathomed before COVID. Behind this activity was unprecedented demand for industrial space from occupiers like e-commerce giant Amazon, mega-retailers including Target, Lowe’s, Best Buy, The Home Depot and Kroger, as well as third-party logistics providers supporting numerous clients reorganizing their supply chain strategies and online sales approaches in response to the pandemic.
Demand was so impressive that net absorption — a demand indicator that measures the net change in occupancy — totaled 598 million square feet nationwide in 2021, more than twice the previous record of 290 million square feet recorded during a particularly strong year in 2016. Last year wasn’t far behind with an annual total of 493 million square feet.
As a result, vacancy in industrial buildings plummeted to all-time lows, dipping as low as 3.5% nationwide during the second quarter of 2022. In some key industrial markets like the Inland Empire, the industrial vacancy rate dropped below 1%, resulting in practically no options for industrial tenants to lease.
Industrial developers responded quickly by acquiring land and building warehouses and distribution facilities on a speculative basis as quickly as they could. Supply chain disruptions for construction materials complicated the process, forcing developers to get creative to get the project done. Pre-leasing of speculative projects — sometimes before construction had even begun — became common, even in markets that had never really witnessed pre-leasing in the past. Demand was still more frothy than ever for modern industrial space and tenants were leasing it more quickly than it could be built.
Higher interest rates and economic uncertainty are a couple of factors behind demand normalizing through the first three quarters of 2023. Net absorption has retreated from its record highs, averaging 60 million square feet per quarter so far in 2023 — in line with what the market witnessed prior to 2020. Developers are still as busy as ever, however, delivering the record amount of construction activity started in 2022. Vacancy is climbing in nearly all markets throughout the U.S. as a result, for the first time in years.
This disconnect between supply and demand will continue through the first half of 2024, as record construction completions outpace how quickly tenants can lease the space. The U.S. industrial vacancy rate is forecast to climb from its all-time low of 3.5% in mid-2022 to the 6.5% forecast during the second half of 2024. While the industrial market is being temporarily overbuilt, the good news is that it won’t last.
About the author
Craig Hurvitz is the director of national industrial research at Colliers International Inc., a real estate services firm. He is responsible for partnering with local research teams to produce research and analysis of industrial trends. Prior to his current role, Hurvitz led a five-person research team in Colliers’ Chicago and Rosemont, Illinois, offices for eight years.
Flexport in conversations to buy Convoy’s technology stack
Flexport is the latest company that’s in talks to buy Convoy’s technology stack, according to a person familiar with ongoing conversations.
The freight forwarding company would hire a small team of Convoy employees. It’s presently unclear how much of the technology stack Flexport would acquire, but the person familiar with the matter said the company would not acquire any of Convoy’s physical assets, such as its trailer pool.
The Wall Street Journal previously reported that, if the deal went through, Flexport “would plan to restore Convoy’s trucking services for as many customers and partners as possible.”
Specifics of the financing are unclear, but the source told FreightWaves that the deal would be “favorable” to Flexport.
Convoy declined to comment on the potential Flexport deal. On Wednesday, Convoy co-founder Dan Lewis confirmed in a LinkedIn post that he was “working on a deal” in which some Convoy team members and some of the company’s technology and operations could be acquired. That lines up with what the source said Flexport was interested in acquiring.
Convoy and Flexport have had a partnership since at least 2021. Flexport customers, through its Convoy integration, were able to gain broader access to domestic truck transportation and gain a more holistic view of their shipping costs.
Meanwhile, Flexport itself has had a tumultuous autumn. The freight forwarder’s board fired then-CEO Dave Clark in September. Following that, Flexport founder Ryan Petersen, who stepped back into the CEO role, cleaned house, letting go of many Clark hires. The Information reported on Sept. 14 that Flexport’s revenue dropped 70% in the first half of 2023.
This is a developing story. Check back here for details.
Whatever became of those splashy electrification startups?
As third-quarter earnings roll in, it is a good time to check the state of electrification startups. Spoiler alert: It is not too encouraging.
The list of electrification startups — be they cars, trucks, chargers or infrastructure — is long and littered with failures. That’s OK since tapping out is often a prerequisite to future success. Or so goes the Silicon Valley mantra.
State of the SPACs
With third-quarter earnings as a trigger, it seemed like a good time to assess how companies FreightWaves covers regularly or from time to time are doing. This is not intended to be inclusive. The categories provide a general state of being more than a ranking.
Most of the startups and early-stage growth companies below merged with a special purpose acquisition company. A SPAC is a market-listed shell company created to target and combine with a young company.
Lax listing rules since toughened by the Securities and Exchange Commission allowed SPACs to present rosy projections of revenue and profits. Investors were mesmerized — for a while.
In the pandemic era, when money was cheap, many of the companies went for the gold, thinking it would always be easy to raise more. Now with higher interest rates and a profits-over-promise mentality in the venture capital world, they have found out differently.
Plugging along
EINRIDE: The Swedish startup makes the list because of its truck-as-a-service placement of electric vehicles. But it is much more. It develops teleoperated driverless vehicles and a digitized freight mobility platform called Saga that gathers data and makes the most of its performance. Einride has big customers and ample financial resources to stick around.
SPAC merger: None. Capital raised: $335 million
ORANGE EV: The manufacturer of short-range, low-speed electric terminal trucks for industrial applications throughout the shipping industry is expanding. It serves retail packaging and distribution, rail yards, ports, and terminals. Founded in 2012, Orange has deployed more than 450 Class 8 heavy-duty “yard dogs” to 130 fleets across 28 states, Canada and the Caribbean.
SPAC merger: None. Capital raised: $435 million
XOS: The startup has to give up its original name — Thor Trucks — because the maker of RV equipment had it first. But Xos is making progress in Class 5-8 electric trucks, winning customers and expanding to larger quarters. It is also making mobile charging equipment and serving the electric distribution yard equipment market.
SPAC merger: August 2021. Gross proceeds: $575 million
Xos revealed its Class 8 HDXT at the Advanced Clean Transportation Expo in May 2022. (Photo: Xos)
On the bubble
HYZON MOTORS: The spinoff of Singapore’s Horizon Fuel Cell Technologies has cleaned up multiple problems created by previous leadership. But it needs more money to advance its 200-kilowatt single-stack fuel cell. A merger or acquisition would be welcomed by CEO Parker Meeks, who sees stationary power generation as a possible additional business.
SPAC merger: July 2021. Gross proceeds: $570 million
LIGHTNING EMOTORS: Shareholders recently cleared the way for borrowing that could keep the maker of electric airport shuttles and Class A (small) buses going for a while. But the Colorado company probably needs a big investor to achieve meaningful scale in electrifying GM chassis made at a Navistar plant in Ohio.
SPAC merger: May 2021. Gross proceeds: $268 million.
Lightning eMotors co-founder and CEO Tim Reeser at a ride-and-drive event on Detroit’s Belle Isle in June. (Photo: Lightning eMotors)
NIKOLA: One of the highest fliers in the early days of the SPAC boom, Nikola has fallen to earth. Its naysayers and short sellers predict its doom, but the fuel cell truck maker and hydrogen infrastructure developer keeps defying detractors. Those who don’t predict its demise suggest a Netflix drama on the soap opera that has played out in the Arizona desert.
SPAC merger: June 2020. Gross proceeds: $760 million.
Down for a dirt nap
ELMS (Electric Last Mile Solutions): The irony of assembling Chinese-made bodies into small electric delivery vans in a plant that once made the hulking Hummer H2 SUV was too rich to ignore. But financial shenanigans on the part of its co-founders led ELMS to a Chapter 7 bankruptcy liquidation with its assets sold to another startup, Mullen Automotive.
SPAC merger: June 2021. Gross proceeds: $379 million
SPAC merger: October 2020. Gross proceeds: $780 million
Finger-pointing following bankruptcy
PROTERRA: The maker of electric buses, battery packs and charging infrastructure equipment weathered the pandemic only to find its lenders prevented it from raising more money. Its Chapter 11 bankruptcy filing likely means new owners for its business units. Shareholders were pretty much wiped out in a Nasdaq delisting of Proterra stock.
SPAC merger: June 2021. Gross proceeds: $640 million
VOLTA TRUCKS: The Swedish startup got scant attention here because it focused on European markets. It is the latest to file for bankruptcy reorganization. Unable to attract the investment needed to scale the business, Volta also blamed the bankruptcy of battery pack maker Proterra Inc. (see above) for creating a critical battery supply issue.
SPAC merger: None. Capital raised: $391 million.
XL FLEET: Founded in 2009 as a converter of drivetrains to run on electricity, the SPAC-backed startup once had a $4 billion valuation. But its ambition to expand into charging and other related businesses burned cash much faster than it generated revenue. The SEC sued successor Spruce Power Holding Corp. in late September, alleging XL Fleet misled investors.
SPAC merger: December 2020. Gross proceeds: $350 million
XL Fleet once had a valuation of $4 billion. But heavy cash burn led to bankruptcy, and its successor company faces SEC charges of earlier wrongdoing. (Photo: XL Fleet)
Like this? We may give autonomous vehicle startups a similar treatment later.
The 7,639 battery-electric trucks amounted to 7.5% of the total trucks sold. That’s still a far cry from half of all new medium- and heavy-duty truck sales being ZEVs by 2035 and the ultimate 2045 goal of 100% clean trucks.
California surpassed its passenger vehicle ZEV goal well ahead of schedule — more than 1.5 million ZEV sales two years before the 2025 goal.
The state makes buying the vehicles, which cost up to three times as much as a diesel-powered truck, less pricey. California has distributed more than $780 million to help fleets purchase ZEV trucks.
Briefly noted …
Daimler Truck North America has begun regular production of its Class 6 Freightliner eM2 medium-duty electric trucks in Portland, Oregon.
Daimler Truck North America has begun regular production of the Class 6 medium-duty Freightliner eM2 electric truck. (Photo: Daimler Truck North America)
Back in June, Truck Tech visited lithium iron phosphate battery maker Our Next Energy in Novi, Michigan, where we interviewed founder and CEO Mujeeb Ijaz. You can catch up with that here if you missed it. What we didn’t share was the lobby of ONE. It is packed with century-old electric vehicles and artifacts. Watch Ijaz explain some EV history and what he’s collected.
Mujeeb Ijaz, founder and CEO of battery-making startup Our Next Energy shares his collection of historic electric vehicles and artifacts.
That’s it for this week. Thanks for reading (and watching). Click here to get Truck Tech via email on Fridays. And catch the latest in major events and hear from the top players on Truck Tech at 3 p.m. Wednesdays on the FreightWaves YouTube channel.
5 advantages of outsourcing driver qualification file management
Hiring qualified drivers and ensuring they remain qualified to drive is central to a good safety compliance program. Trucking companies must ensure all new and existing drivers are up to code with state and federal regulations governing truck drivers, which indicates they meet the minimum safety and health requirements to operate a commercial motor vehicle. A driver’s record of these qualifications is called a driver qualification (DQ) file.
Because of the frequent onboarding due to high driver churn — and the use of leased, temporary or fill-in drivers — as well as outdated filing systems and overwhelmed staff, it can be a challenge for motor carrier staff to interpret Federal Motor Carrier Safety Administration requirements and keep up with DQ file management.
In fact, keeping compliant and organized DQ files was so much of an obstacle for companies that 42% of safety leaders reported it as the top issue pertaining to FMCSA compliance, according to J. J. Keller Center for Market Insights’ 2023 State of Fleet Management survey. The other two critical issues were staying up to date on regulation changes (42%) and having all files in place to manage and audit compliance (35%) — both of which are also critical to DQ file management.
Augmenting a carrier staff with state and federal regulatory experts can help an organization go above and beyond the minimum recordkeeping requirements.
J. J. Keller & Associates Inc., the trucking industry’s trusted safety and compliance specialists, shared five ways that outsourcing DQ file management to experts can help businesses stay in good regulatory standing and reduce the risk of a negligent hiring claim.
Advantages of outsourcing your DQ file management
1. Gain access to regulatory experts.
FMCSA regulations are complicated, especially because requirements aren’t uniform for drivers; companies must consider intricacies such as whether a driver has a CDL, whether the driver has a hazmat certification and whether the driver is interstate or intrastate.
“In a multistate operation where drivers operate commercial motor vehicles on an intrastate-only basis in several states, the complexity of managing driver qualification files makes regulatory experts imperative. Carriers must know when driver qualification files are required for intrastate-only drivers, and the files must be accurate per each state’s adoption of the safety regulations,” said Mark Schedler, senior editor of transportation management at J. J. Keller.
Trusted outsource partners can keep carriers current on complex federal and state driver qualification requirements and how they apply to their fleet as well as answer any compliance questions they have.
2. Streamline and vet each hire.
High driver turnover resulting in frequent onboarding, as well as the constant need to keep drivers’ files up to date, leaves employees less time to dedicate to thoroughly vetting new drivers. Without rigorous screening of a driver prior to hiring, however, a company risks a major red flag slipping through the cracks. In the worst scenario, if a driver is involved in a crash, it could lead to a negligent hiring claim.
“Inconsistencies with hiring documents and carriers missing safety issues on drivers’ motor vehicle records and the safety performance history or prior employer verifications create safety management control gaps that can be exploited in litigation,” Schedler said.
Third-party experts can help businesses examinecandidates to avoid the acute and critical violations outlined in Appendix B to Part 385 Section VIII of the Federal Motor Carrier Safety Regulations (FMCSRs). An acute violation is a one-time violation that requires immediate corrective action. Critical violations demonstrate a pattern of noncompliance. In the eyes of the FMCSA, both types of violations demonstrate issues with a company’s safety performance and can lead to an investigation.
Motor vehicle record (MVR) codes and formats can vary state by state. Experts are familiar with these differences and can help companies complete the required MVR review at hire and annually. Additionally, they can score MVRs and monitor MVR activity year-round, which is a best practice.
3. Track company-specific and FMCSA-required qualification renewable documents.
FMCSA-required documentation must be renewed at varying intervals. This can include proof of medical certification, vehicle operator’s license for CDL and non-CDL drivers, annual motor vehicle records and annual reviews, and DOT drug and alcohol testing policy receipts at times of hire and after policy changes. Managing all of these moving parts can quickly become time-consuming, complex and overwhelming, especially when companies have hundreds of drivers.
Outsourcing these efforts to top-tier DQ file management providers can help companies alleviate the burden, give them time back and offer peace of mind. Experts can track documents required by federal and state agencies as well as documents required by company-specific safety policies and procedures.
4. Keep DQ files audit-ready.
If a company is struggling to keep up to date with day-to-day DQ file management, it’s unlikely staff have the bandwidth to thoroughly self-audit their files. When a company is selected for an audit, however, it will likely come with little notice before the business is asked to produce documents.
Further, plaintiffs’ attorneys use the FMCSRs and carrier policies and procedures as a road map to determine negligence. Without audit-ready files, a company may find itself in a precarious position.
J. J. Keller Managed Services audits each DQ file against 170 different items. If company-specific documents are involved, the audits are even more detailed. It helps carriers quality check their work and fix issues way before an audit occurs and the issues come to light. They also help clients who are selected for an audit by preparing their paperwork and supporting them through the entire process.
5. Centralize and secure remote access to electronic files.
FMCSA does not have specific security requirements for DQ files. However, carriers must limit access to these files to only people needing to know, such as someone in human resources or the safety director, to protect driver privacy.
According to FMCSR 391.53(a), any document in the safety performance history file must be under secure, controlled access limited to those involved in the hiring process.
If a company is still using hardcopy records, it should consider entrusting the conversion to a DQ file management vendor. FMCSA and internal company audits are much more manageable and easier to secure when files can be accessed completely electronically. Unique user identification information is a basis for secure access to electronic files instead of keys or combinations.
Approved users can also remotely review electronic files instead of being in the central office where records are stored. This is especially useful because FMCSA has increased the use of focused off-site/remote audits in which all documents must be converted to electronic use for those audits.
J. J. Keller’s Managed Services’ 70-plus team members can help companies identify compliance weaknesses, review files and policies, and recommend corrective action. All the while, they provide expert oversight, extensive data security and resources to motor carriers to help them maintain effective safety programs.