Revenue per driver per week reached a record high in October 2018, according to TCA data housed inside FreightWaves’ SONAR. The data indicates a 16% jump, from $3,659 to $4,256, between September 2018 and October 2018.
Drivers also brought in about 10% more revenue per week in October than the $3,840 average for the year.
TCA’s revenue per driver per week data is collected from a sample of asset-based carriers that participate in TCA Best Practice Groups.
FreightWaves Senior Market Analyst Zach Strickland recently reported that FreightWaves’ SONAR data shows intermodal rail traffic (RTOIC.USA) experienced its biggest year by volume for the second year in a row in 2018, climbing 4.8% over 2017 volumes. This increase was ushered in by international shippers moving as much inventory into the U.S. as possible thanks to tariff concerns.
The spike in revenue per driver per week came alongside record container volumes at the Los Angeles, California ports. Both Los Angeles and Long Beach experienced a standout October in terms of loaded inbound container volume, coming in 17.6% higher than 2017, causing outbound L.A. volumes to exceed peak summer levels into the fall season, according to Strickland.
“Intermodal hubs like Chicago saw outbound volumes surge over inbound volumes as containers got off the rail in the Midwest and were distributed throughout the eastern half of the country,” Strickland said in his report. “The Headhaul index for Chicago (HAUL.CHI) – which measures the amount of outbound minus inbound volume – hit its highest point in the first week of October of 67.24 when the rest of the freight market was dropping. A positive Headhaul Index value indicates outbound trucking volume exceeds inbound volume.”
Many of the final destinations for this intermodal freight are not serviced by railroads, so the freight finds its way onto trucks. This means high volumes provide the ideal environment for revenue per driver per week to climb.
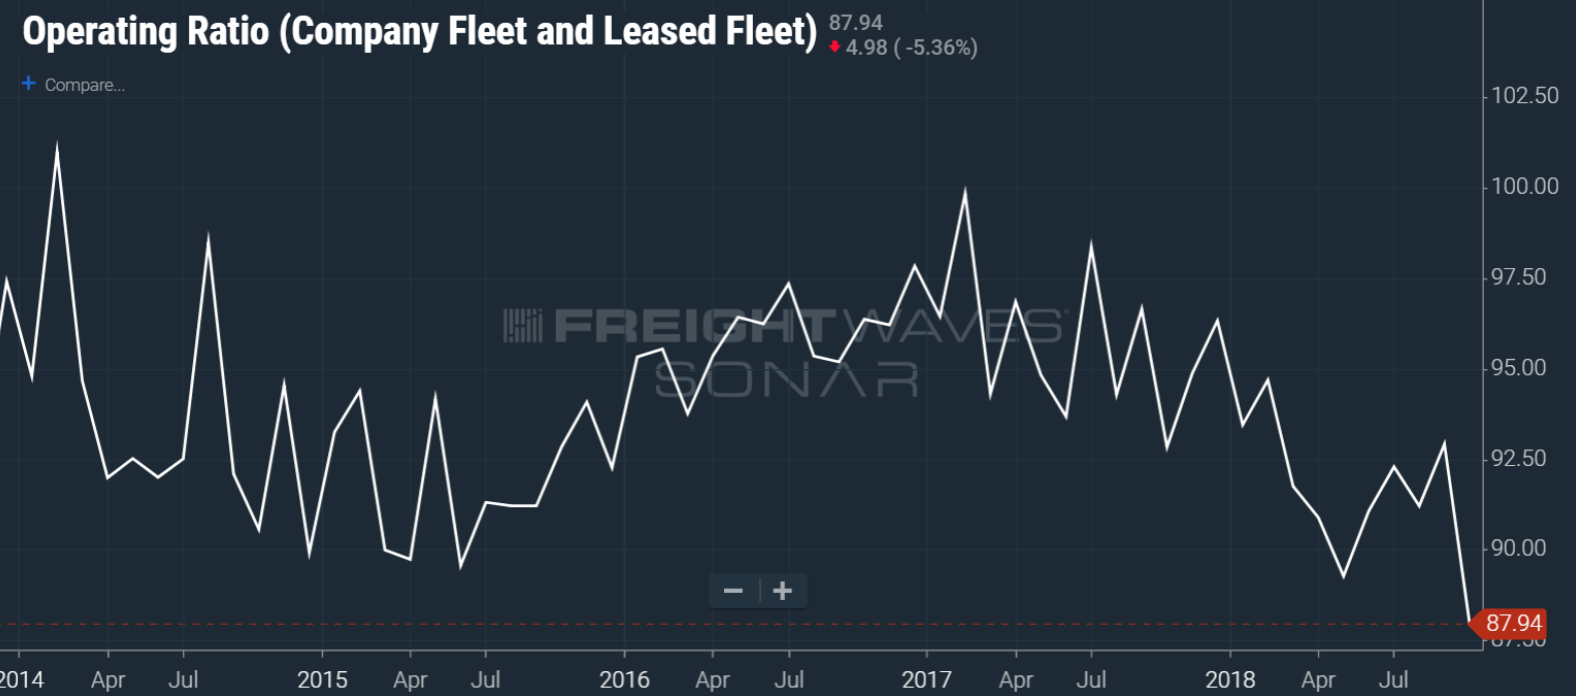
Carriers also experienced falling operating ratios in October, according to TCA data housed inside FreightWaves’ SONAR. The average OR fell from the low 90s in September to about 88 in October, meaning the operations required less money to generate revenue
(CHART: DATA FROM TRUCKLOAD CARRIERS ASSOCIATION INSIDE FREIGHTWAVES’ SONAR)
Strickland contributed falling ORs to the fact that most of fall 2018’s volume came from southern California, as well as the lack of disruptive events.
“Carriers have benefited from consistent freight patterns and elevated rates enabling them to get the best of both worlds, leading to increased operating efficiency and more revenue for the same work,” he said.
Carriers experienced a perfect storm of advantageous factors last fall, likely leading to the substantial surge in revenue per driver per week seen in October.
Although new guidance on mask wearing returns the industry to some semblance of normalcy after over a year of lockdowns and restrictions, employers should remain cautious in revising policies.
While Texans are accustomed to living life free of excessive state-level taxes, they were in for a shock when their own U.S. Senator, Republican John Cornyn, used his national platform to advocate for the establishment of a truck-only vehicle miles traveled tax.
As we discuss ways to improve the sales relationship between carrier and shipper, the term “commodity” always comes up. Most carriers feel being a commodity diminishes the services they provide. It doesn’t have to be that way.
The nation’s top trucking research group plans to update previous studies on the effects of legalized marijuana and other drugs on truck safety along with integrating 18- to 20-year-old drivers into the industry.
Throughout the entire 90-year history of trucking in the United States, excessive detention has been a scourge on the industry. An upcoming 90-minute immersive workshop will share tools and strategies to combat this issue and keep the wheels moving and profitable.
While a request for Supreme Court review of the Ninth Circuit Court of Appeals decision to overturn an injunction banning enforcement of California’s AB5 will almost certainly follow, at this time, motor carriers who operate in California must be prepared to act in accordance with AB5.
The word “safety” is everywhere in the trucking industry. It is talked about nearly every day in the press, Congress has zeroed in on it, and most carriers will say that it is their top priority. With all this attention, it’s easy to believe that safety has become cliché. But it’s not.
A day after Colonial Pipeline said there was light at the end of the tunnel for the line’s closure due to a cyberattack, the impact of the shutdown on the ground is being felt.
Truck drivers and fleets have two months to prepare for the Commercial Vehicle Safety Alliance’s (CVSA) annual Operation Safe Driver Week, which is set for July 11-17. Here is what inspectors will be looking for.
Ashley is interested in everything that moves, especially trucks and planes. She works with clients to develop sponsored content that tells a story. She worked as reporter and editor at FreightWaves before taking on her current role as Senior Content Marketing Writer. Ashley spends her free time at the dog park with her beagle, Ruth, or scouring the internet for last minute flight deals.