Economics of the New Canadian Tit-for-Tat Tiff Tariffs
On September 8, the disagreement escalated past tariffs entirely. The U.S. announced it would outright ban imports of Canadian dairy, alcohol, and large-displacement motorcycles, effective September 29. Not another rate hike, a straight prohibition. It’s the newest turn in a dispute that’s been building for months: on August 22, eleventh-hour talks between Washington and Ottawa collapsed and the U.S. imposed 50% tariffs on roughly $20 billion of Canadian goods, and Canada matched the U.S. “dollar for dollar” two days later with its own retaliatory duties. Those are already old news next to the ban.
What makes the ban worth dwelling on is why these three categories specifically. A senior administration official told CBC the list wasn’t arbitrary: the U.S. “purposely selected items where Canada has pretty low import penetration in the United States, or the United States has substantial domestic production or gets it from other places.” That’s a striking thing for a government to say out loud about its own trade action. It’s an admission, in the administration’s own words, that this move isn’t really about shielding a vulnerable domestic market from Canadian competition. It’s the exact question this piece keeps coming back to, just answered directly by the people who made the call.
I know this sounds like the usual political harrumphing, at which the markets may shrug. Indeed, if you look at SONAR data around the ban announcement, that’s largely the case. SONAR’s Total Outbound Loaded Rail Container Volume index for the Canada-to-U.S. lane, ORAILL.CANUSA, tells an interesting, if muted, story. From February 8 of this year through late August, the index ran a slight decline: noisy day to day, but a regression line through the whole stretch shows a statistically significant drop of roughly 10%. The drop is not huge, but it’s the kind of move that doesn’t happen by chance even with that much daily volatility. That looks like a market playing things close to the chest, volume eroding gradually as the broader Section 301 and Section 338 fight dragged on for months, without any single sharp break.
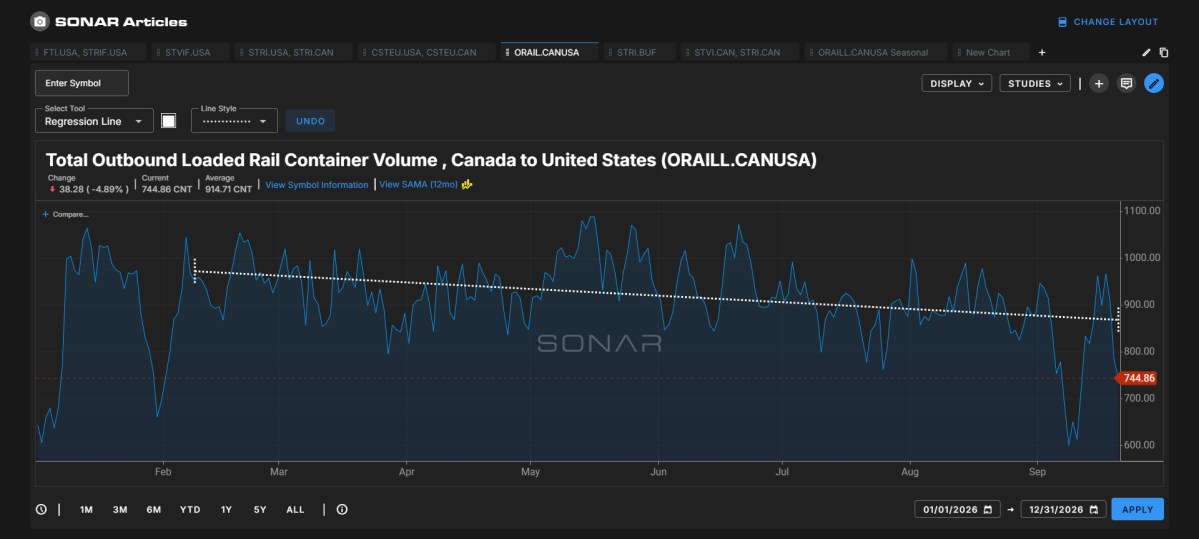
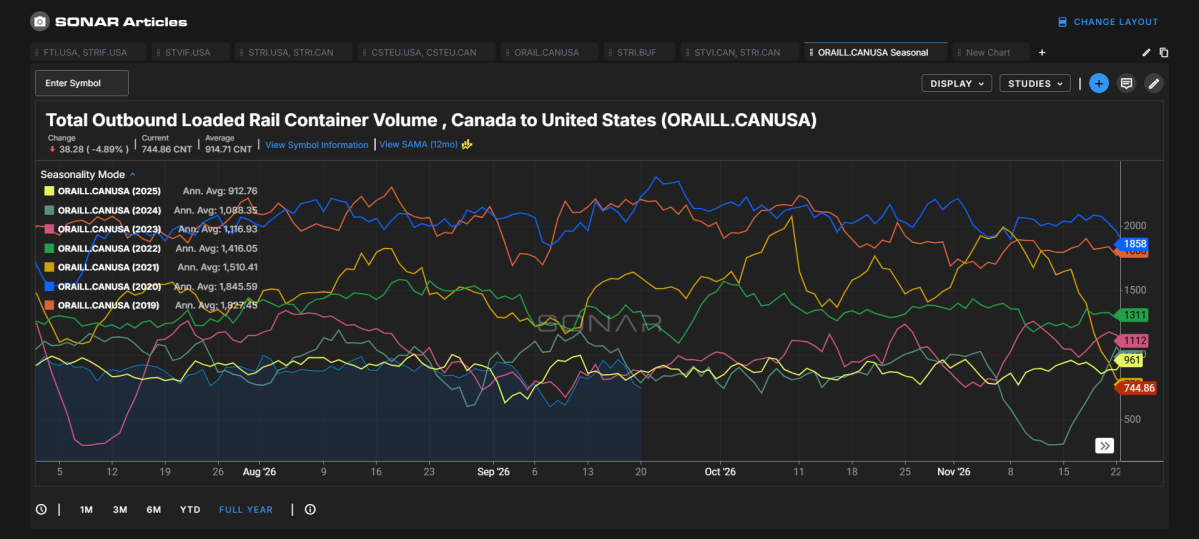
Then, in the first week of September, the index did fall sharply, from the 900s down to a low of 601 on September 8, the exact day the ban was announced. However, a dip around Labor Day is normal for this index, and while this year’s trough, alongside 2024’s, ranks among the lowest Labor Day readings in SONAR’s eight years of data, the dip didn’t stick. Within a week and a half, the index had round-tripped back above 960 (actually higher than where it sat just before the dip) before settling back into the same 750-900 band it had been running in most of the year. Put together, the honest read is that not much actually happened here: a real, gentle decline over many months, a sharp but short-lived wobble exactly when the ban made headlines, and a quick return to something close to normal. That’s consistent with a broader pattern worth flagging up front: these bans hit hard in the specific sectors they target, but their footprint on the overall freight network, and by extension the broader economy, looks slight.
This latest disagreement with our northern neighbor doesn’t exist in isolation. It lands on top of a much broader tariff regime the administration rolled out this summer: a Section 301 action covering 60 economies, including Canada, that took effect July 24 over allegations that those countries fail to adequately police forced-labor goods. Canada’s baseline rate under that action is 10%. The August escalation produced something more unusual on top of that baseline. On July 20, POTUS signed three separate proclamations invoking Section 338 of the Tariff Act of 1930 (a 96-year-old statute that, per CSIS’s rundown of the action, no president had ever actually invoked before) to impose an additional 50% tariff on Canadian dairy, motor vehicles, and alcoholic beverages, one proclamation per sector, each tied to a specific finding that Canada was discriminating against U.S. commerce in that category: better dairy-quota access for the EU than for U.S. exporters, retaliatory tariffs that hit only U.S.-made vehicles, and Canadian alcohol boycotts targeting U.S. products. Fifty percent isn’t an arbitrary round number, either. It’s the statutory ceiling Congress wrote into Section 338 itself. The September ban falls on those same three sectors (dairy, alcohol, motor vehicles), just swapping the 50% duty for an outright prohibition on the specific product lines named above.
Sizing Up the Ban
The CBC official’s “low import penetration” line is worth actually checking against the numbers, not just taking on faith. Here’s what each banned category looks like against total U.S. market size, using 2025 data:
| Banned Good | 2025 Canadian Imports (M USD) | 2025 US Market Size (M USD) | Canadian Import % of US Market | US 2025 FAS Trade Balance (M USD) |
|---|---|---|---|---|
| Beer | 19.2 | 35,900 | 0.053% | -2.6 |
| Molasses | 0.8 | 8,980 | 0.009% | +11.3 |
| Motorcycles >800cc | 80.6 | 6,100 | 1.321% | +39.1 |
| Non-Alcoholic Beer | 4.8 | 583.4 | 0.823% | -2.2 |
| Spirits | 673.0 | 36,410 | 1.848% | -495.7 |
| Whey/Dairy | 34.9 | 1,800 | 1.939% | +33.6 |
| Wine | 62.1 | 13,480 | 0.461% | +41.8 |
Import and Trade Balance Data Source: USITC DataWeb
US Market Size Data Sources: Mordor Intelligence, Distilled Spirits Council of US, Grand View Research, Brewers Assoc.
NOTE: Negative Trade Balance indicates greater imports than exports.
Four of the seven categories don’t even crack 1% of the U.S. market they’re being excluded from: beer, molasses, non-alcoholic beer, and wine all sit under half a percent, about as close to a rounding error as trade statistics get. That’s the CBC quote checking out in plain numbers. The other three (motorcycles, spirits, and whey/dairy) cross into “real, if still modest” territory, landing in a tight band between 1.3% and 1.9%.
The trade-balance column adds a wrinkle worth sitting with. In four of the seven categories, the U.S. actually runs a surplus with Canada: it sells more of that good to Canada than it buys back, even in a category it’s now banning. Whey/dairy is the clearest example: Canada supplies the largest import share in the whole table (1.939%), and yet the U.S. still sells $33.6 million more dairy to Canada overall than it buys back. Whatever leverage exists in that relationship points toward the U.S., not away from it.
Spirits is the outlier, and it’s not close. The category doesn’t have the highest import share in the table (that’s whey/dairy), but it carries by far the largest trade deficit, at $495.7 million, more than ten times the size of the next-largest imbalance and running in the opposite direction of every other alcohol or dairy line. Canada’s spirits exports to the U.S. are dominated by liqueurs and cordials ($385.7 million) and Canadian-style whiskies ($207.9 million combined): real consumer products, not the commodity inputs driving most of the rest of this table. This suggests that, out of the banned products discussed, spirits is the category likely to have the greatest impact.
Although ORAILL data did move around the September 8th Canadian tariff retaliation and subsequent U.S. ban, they still exist as part of the broader tariff dispute. And, we can see these tariffs are of a scale worth considering. So, I want to focus on the tariffs themselves, as they are apt to have a larger overall impact. Before we proceed further, let’s clarify something for people who are relatively new to the conversation: tariffs are taxes. Full stop. Don’t let anyone tell you they’re some specialized policy tool; they’re still taxes at the end of the day. Specifically, tariffs are taxes on imported goods. Now, given that they are taxes, as an economist, my ultimate question to such is always, “Who actually pays the tax?” That’s the more interesting and useful question, and there is a whole body of literature on the subject of “tax incidence” surrounding it. Briefly, the answer of “who pays?” comes down to one primary thing: market power, in the form of monopoly and monopsony (I’ll explain that second one more below). Market power itself comes from four things: what’s actually being taxed, how much of it either country can realistically make itself, whether either side has any leverage in the underlying market, and what that leverage does to where the price ultimately lands.
What’s Actually on the Truck
Let us start with the tariffed goods list, because it’s oddly specific and tells you a lot about how these fights escalate. The U.S. tariffs hitting Canada run from hockey sticks to dairy to alcohol to flower bulbs to agricultural products, a fairly random-looking basket that reflects less an industrial strategy than which product categories happened to be on the table when talks broke down. Canada’s retaliation list is more deliberately targeted: steel and aluminum products (already facing a prior 25% counter-tariff, now doubled to 50%), furniture, clothing and apparel, plus dairy, appliances, agricultural equipment, pulp and paper, and electronics, more than 800 tariff line entries in total.
Every good on both lists really answers two separate questions: “does the other country even make enough of this to matter” and “does my own country make a good substitute.” Different goods on these lists answer them very differently. Two of the three Section 338 categories make that especially clear: motor vehicles, and alcohol (specifically, Canadian icewine).
The Same Coin, Two Sides: Monopoly and Monopsony
I said I would explain that odd term, “monopsony,” and it’s worth doing before we get into the examples. Most people have a solid understanding of monopoly, for reasons beyond playing the board game of the same name: there are ample U.S. laws and legal cases surrounding the term. Defined simply, it is a market in which there is just one seller, many buyers, and the seller sets the price. Think of your local cable TV or internet provider in a town with only one wired network. If you want cable TV or wired high-speed internet, you have exactly one option. The provider doesn’t have to worry much about losing you to a competitor. There isn’t one. So, it can charge more than a competitive market would produce, and most customers pay it anyway, because the alternative is going without.
Monopsony is the same idea flipped upside down: one buyer, many sellers, and the buyer sets the price. The classic real-world example is a rural hospital that’s the only major employer of nurses and doctors in the area. That hospital isn’t selling anything to a captive audience. It’s buying labor from one. Nurses and doctors who want to keep working in that town have exactly one employer to sell their hours to. So the hospital can hold wages below what a competitive labor market would otherwise pay, and the nurses mostly keep showing up anyway, because relocating or leaving the profession is a bigger cost than accepting the lower wage.
Look at those two examples side by side and you’ll notice they’re structurally identical, just mirrored. In both cases, there’s one dominant operator sitting across the table from a fragmented, comparatively powerless counterparty. The only thing that changes is which side of the transaction the dominant player occupies: selling, in the cable case; buying, in the hospital case. Economists treat them as the same underlying phenomenon (concentrated market power) because the mechanism is identical, just facing in opposite directions.
Why does any of this matter for a 50% tariff on Canadian goods? Because the same logic scales up from a single company to an entire country, and a tariff changes who has leverage over whom in that transaction. Motor vehicles look, at first glance, like a clean case of U.S. buyer power. Icewine turns out to be the cleaner example, just pointed the other way.
Motor Vehicles: The Dubious Monopsony Case
On paper, autos look like the textbook setup. Canada’s own government says more than 90% of Canadian-made vehicles and 60% of Canadian-made auto parts are exported to the U.S. Only about 7% of Canada’s vehicle exports go outside the CUSMA region at all, and domestic Canadian demand absorbs just 9.4% of what the country manufactures. That’s about as captive a supplier as you’ll find in a real industry: no meaningful alternative market to redirect to if U.S. demand softens.
But the clean story falls apart once you look at the other direction of trade. Canada isn’t just a seller here; it’s also a large buyer of U.S.-made vehicles. Over the last decade, roughly 49% of vehicles sold in Canada were U.S.-made. That’s the same integrated North American auto sector cutting both ways: Canada may have nowhere else to sell its own output, but it has real retaliatory leverage as a buyer of U.S. output, which is exactly what showed up when Canada’s own counter-tariffs specifically targeted U.S.-built vehicles. If this were a genuinely one-sided monopsony, Canadian producers would likely be absorbing a meaningful share of the U.S. tariff themselves. In an integrated, two-way-dependent market like this one, the more honest answer is: probably some, but nowhere near what the 90% export-dependency number alone would suggest.
Icewine: A Cleaner Example of the Opposite Problem
Wine sits on the tariff list too, bundled with wood, paper, and hockey products under the same Section 338 alcohol proclamation. Most of that category behaves like autos in reverse of the story above: the U.S. has a deep, competitive wine industry ready to fill the gap, so there’s no real market power on either side. But icewine, Canada’s signature wine product, is the exception. Canada is the world’s dominant producer, by a wide margin, while U.S. output is so small it isn’t tracked as its own category, just a handful of Finger Lakes and Michigan wineries dependent on a hard freeze arriving at exactly the right moment. And unlike the auto sector, Canadian icewine exports are genuinely diversified: China has historically taken the largest share, more than a third, with the U.S. second at roughly 23.5%. Canada isn’t cornered into needing U.S. buyers here the way its auto sector is.
You could argue that muscadine, a very sweet wine native to the U.S. Southeast, is a substitute, but a $12 bottle of muscadine and a $50 half-bottle of icewine aren’t really competing for the same purchase. So, for the example below, I’ll assume icewine buyers want that specific product and won’t be swayed by a cheaper, unrelated substitute. Unlike autos, this is close to a clean case: no domestic competitor to converge prices with, and no desperate need to protect U.S. volume.
From Market Power to Who Actually Pays
Here’s the mechanism, stripped down. When a tariff taxes an import, it changes the competitive landscape for every domestic producer competing against that import. For a good with a real domestic substitute (most of what’s on these tariff lists, including ordinary wine), the tariffed import gets more expensive, domestic producers face less pressure to hold their own prices down, and both prices drift upward together even though only one was taxed.
Icewine breaks that story, because one side of it is missing. Say a 375ml half-bottle sells for $50 before any tariff. Under the Section 338 duty, that lands at $75. The few U.S. producers can increase their price to $70, capturing additional profits. The $25 increase mostly just becomes the American buyer’s problem. That’s the flip side of the coin from the auto example, with Canada sitting closer to the cable company’s seat than the hospital’s.
It should be noted that the monopsony dynamics will play out the same way for Canadian consumers under the counter-tariffs imposed by their own government in Ottawa. Unless Canada is a monopsony buyer for a good purchased from the U.S., the typical Canadian buyer of tariffed goods will be the ones most impacted by the change in prices, not American producers. While I am admittedly not versed enough in Canadian production to know if such monopsonies exist, my suspicion is that the situations are similar.
Back to the Freight Network
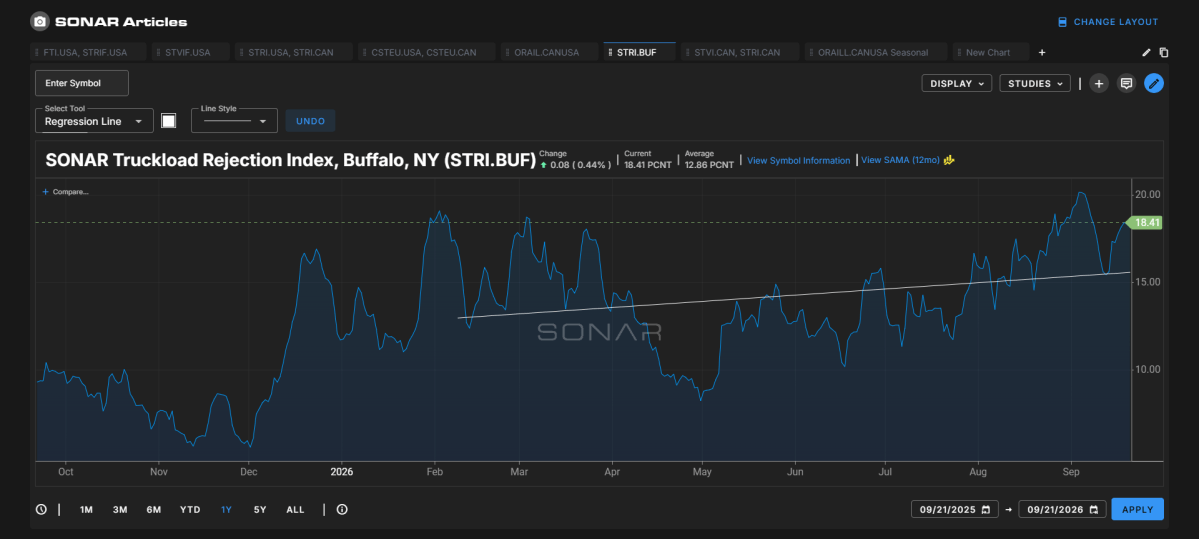
Regardless, that’s the economics of the situation. The freight side of the story is really just this dynamic being revealed as physical volume moves through the network. The ORAILL.CANUSA move described earlier is what a market absorbing a slow-burning dispute looks like on the ground: months of quiet, statistically real erosion, a sharp wobble right when the ban made news, and a quick round-trip back to normal. National truckload capacity data shows a related, smaller signal too. STRI.BUF, the tender-rejection rate for Buffalo, NY (sitting right on one of the busiest Canada-U.S. freight corridors), climbed from roughly 12% in mid-June to a peak just over 20% in early September, coming in slightly lower as of this writing to 18.41%, suggesting a tight market.
Canada’s own national truckload data adds a wrinkle here, though it’s worth flagging as a curiosity rather than a trend to build a forecast on. SONAR’s Truckload Rejection Index for Canada, STRI.CAN, has fallen sharply since February, from roughly 7.5% down to 3.57%, more than cut in half, while SONAR’s Truckload Volume Index for Canada, STVI.CAN, has actually risen modestly over the same stretch, from around 13,700 to 14,475. Rejections falling while volume rises is, on its face, the opposite of what trade-war strain on Canadian capacity would predict. However, this may only reflect ordinary carrier entry and seasonal effects layered on top of everything else in play, rather than the tariff fight itself.
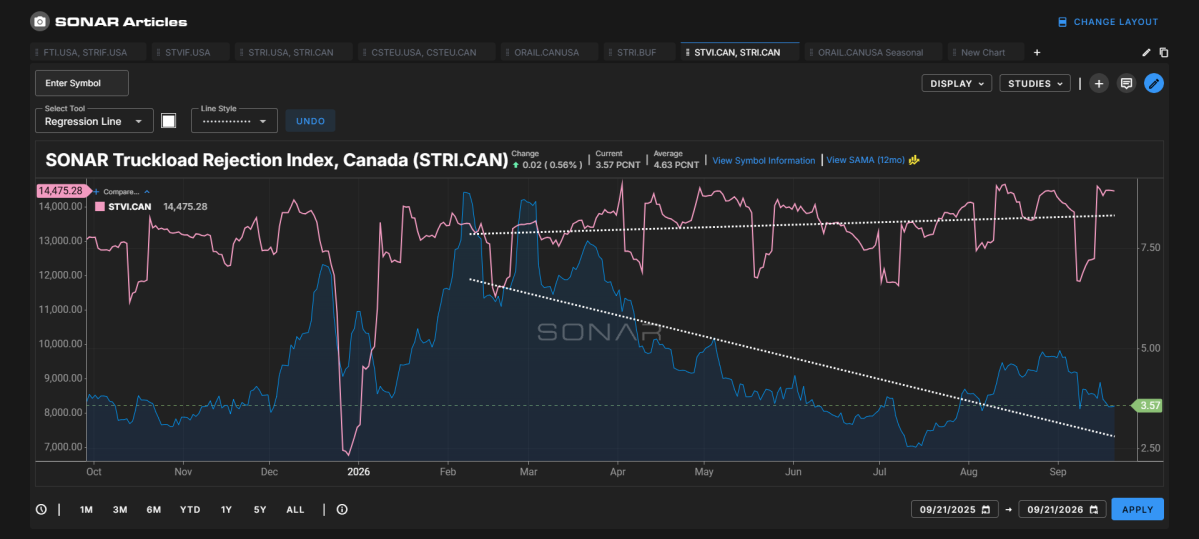
SONAR Tickers: STRI.CAN, STVI.CAN
Whether this settles into a genuine trade realignment or another round in an ongoing tit-for-tat depends on how long politicians stay dug in. But the freight data doesn’t wait for a political resolution. It’s already telling the story of a supply chain adjusting in real time to a fight neither side seems ready to end. Finally, since there are practically no Canadian goods for which the U.S. is a clean-cut monopsony buyer, it means that American consumers will foot the U.S. government’s tax bill the entire time.
For more information on SONAR, visit gosonar.com.
Brokerage Compliance Symposium
The day before F3. Every compliance issue you face - fraud exposure, carrier liability, FMCSA rules, cargo theft, insurance gaps - navigated by attorneys and operators defining best practices in a changing industry.
F3 Awards Dinner
The night before F3. FreightTech100 companies honored. FreightTech 25 and Shipper of Choice winners revealed live. Cocktail reception into dinner and live music - 300 industry leaders in one purpose-built room.
F3: Future of Freight Festival
Industry-defining keynotes, rapid-fire technology demos, and industry leaders networking in experiences across Chattanooga - plus the inaugural F3 Awards Dinner featuring the FreightTech and Shipper of Choice reveals.
The day before F3. Every compliance issue you face - fraud exposure, carrier liability, FMCSA rules, cargo theft, insurance gaps - navigated by attorneys and operators defining best practices in a changing industry.
The Signal at Chattanooga Choo Choo • Chattanooga, TN Register NowThe night before F3. FreightTech100 companies honored. FreightTech 25 and Shipper of Choice winners revealed live. Cocktail reception into dinner and live music - 300 industry leaders in one purpose-built room.
The Signal at Chattanooga Choo Choo • Chattanooga, TN Register NowIndustry-defining keynotes, rapid-fire technology demos, and industry leaders networking in experiences across Chattanooga - plus the inaugural F3 Awards Dinner featuring the FreightTech and Shipper of Choice reveals.
The Signal at Chattanooga Choo Choo • Chattanooga, TN Register Now