FreightWaves continues to enhance the SONAR platform by adding the following new data and features this week:
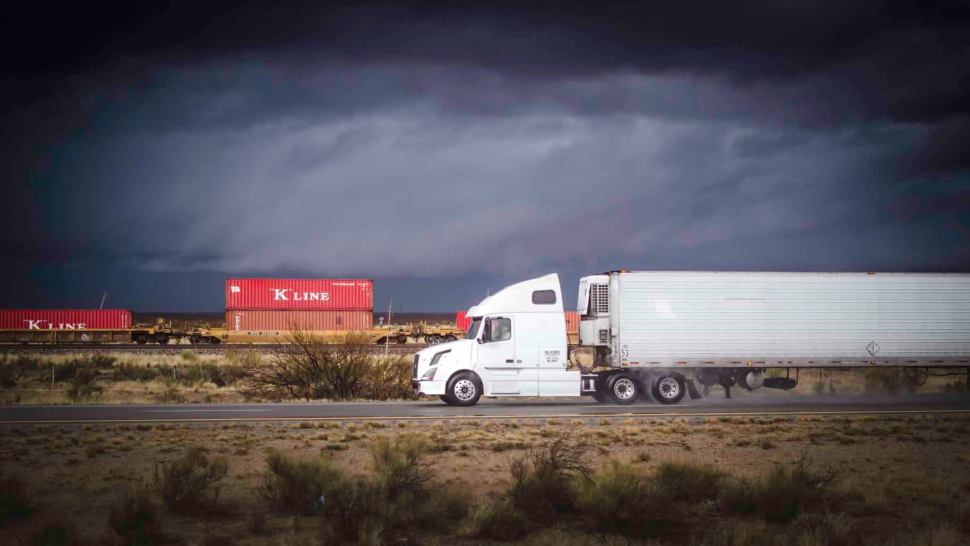
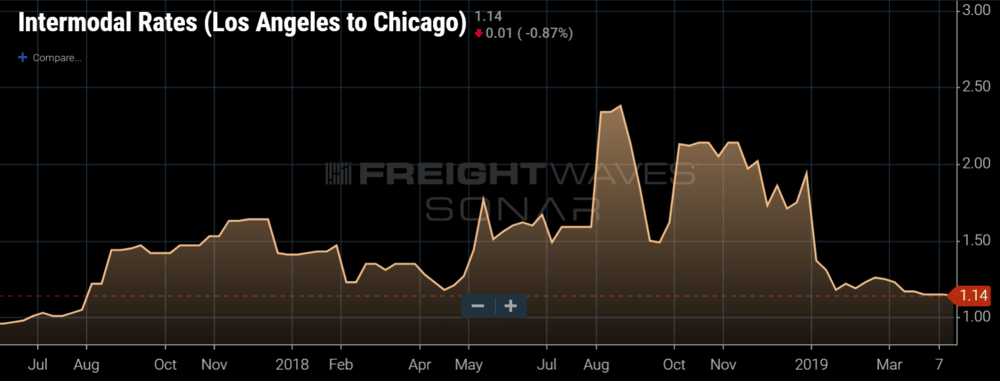
FreightWaves is bulking up on its multimodal transportation industry data by adding weekly intermodal spot rates and daily maritime container shipping spot rates to SONAR. Intermodal has been growing consistently in the freight industry having a record amount of shipments over the rails in 2018. The intermodal sector has a strong correlation with the general freight market and how well it is performing due to the fact much of the freight coming into the U.S. internationally is shipped in a container either on the ocean or via rail. In addition to weekly intermodal carload volumes already in SONAR, users will have the average spot rate to ship an intermodal container in 39 of the largest volume lanes in the U.S.
In order to pull up an intermodal rate in SONAR users will type the ticker INTRM.LANE. For example, to pull up the rate for Los Angeles to Chicago the full ticker would be INTRM.LAXCHI.
INTRM.LAXCHI
In addition to weekly values there will be a series of “delta” values available as well to make it easier to see changes in each lane’s rates quickly. Their ticker symbols are the following:
INTRMW – Weekly change
INTRMF – Bi-weekly change
INTRMM – Monthly change
INTRMQ – Quarterly change
INTRMY – Annual change
As mentioned above, much of the intermodal freight comes in via ocean shipping. In order to give users more visibility into this mode of transport, SONAR users will now have daily spot rates for shipping forty-foot containers (FEU) from the Freightos Baltic Exchange in addition to the current weekly values that are available each Monday.
Users will type FBXD.LANE to get the average daily spot rate in each lane. For example, to pull up the daily rate from China to North America’s West Coast the user would type FBXD.CNAW.
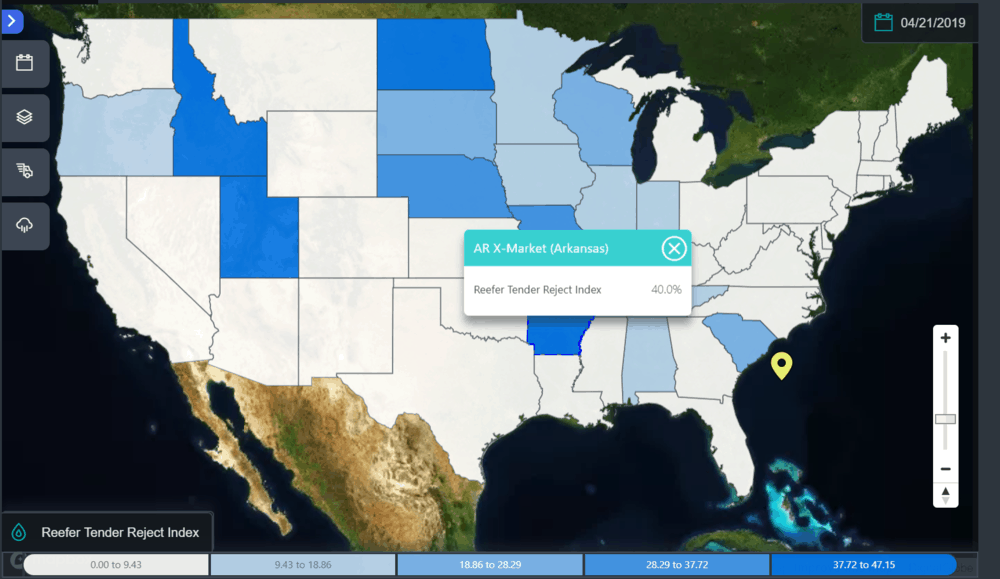
In addition to the intermodal and maritime rates above SONAR users will now be able to see tender rejection rates for temperature-controlled freight or “reefer” trailers on state and regional level granularities. These will be available on the map and in chart widgets. The user will type RTRI.STATE or REGION CODE. For example to see a chart of reefer tender rejection rates for the Midwest the user would type RTRI.URMW.
Brokerage Compliance Symposium
The day before F3. Every compliance issue you face - fraud exposure, carrier liability, FMCSA rules, cargo theft, insurance gaps - navigated by attorneys and operators defining best practices in a changing industry.
F3 Awards Dinner
The night before F3. FreightTech100 companies honored. FreightTech 25 and Shipper of Choice winners revealed live. Cocktail reception into dinner and live music - 300 industry leaders in one purpose-built room.
F3: Future of Freight Festival
Industry-defining keynotes, rapid-fire technology demos, and industry leaders networking in experiences across Chattanooga - plus the inaugural F3 Awards Dinner featuring the FreightTech and Shipper of Choice reveals.
The day before F3. Every compliance issue you face - fraud exposure, carrier liability, FMCSA rules, cargo theft, insurance gaps - navigated by attorneys and operators defining best practices in a changing industry.
The Signal at Chattanooga Choo Choo • Chattanooga, TN Register NowThe night before F3. FreightTech100 companies honored. FreightTech 25 and Shipper of Choice winners revealed live. Cocktail reception into dinner and live music - 300 industry leaders in one purpose-built room.
The Signal at Chattanooga Choo Choo • Chattanooga, TN Register NowIndustry-defining keynotes, rapid-fire technology demos, and industry leaders networking in experiences across Chattanooga - plus the inaugural F3 Awards Dinner featuring the FreightTech and Shipper of Choice reveals.
The Signal at Chattanooga Choo Choo • Chattanooga, TN Register Now