


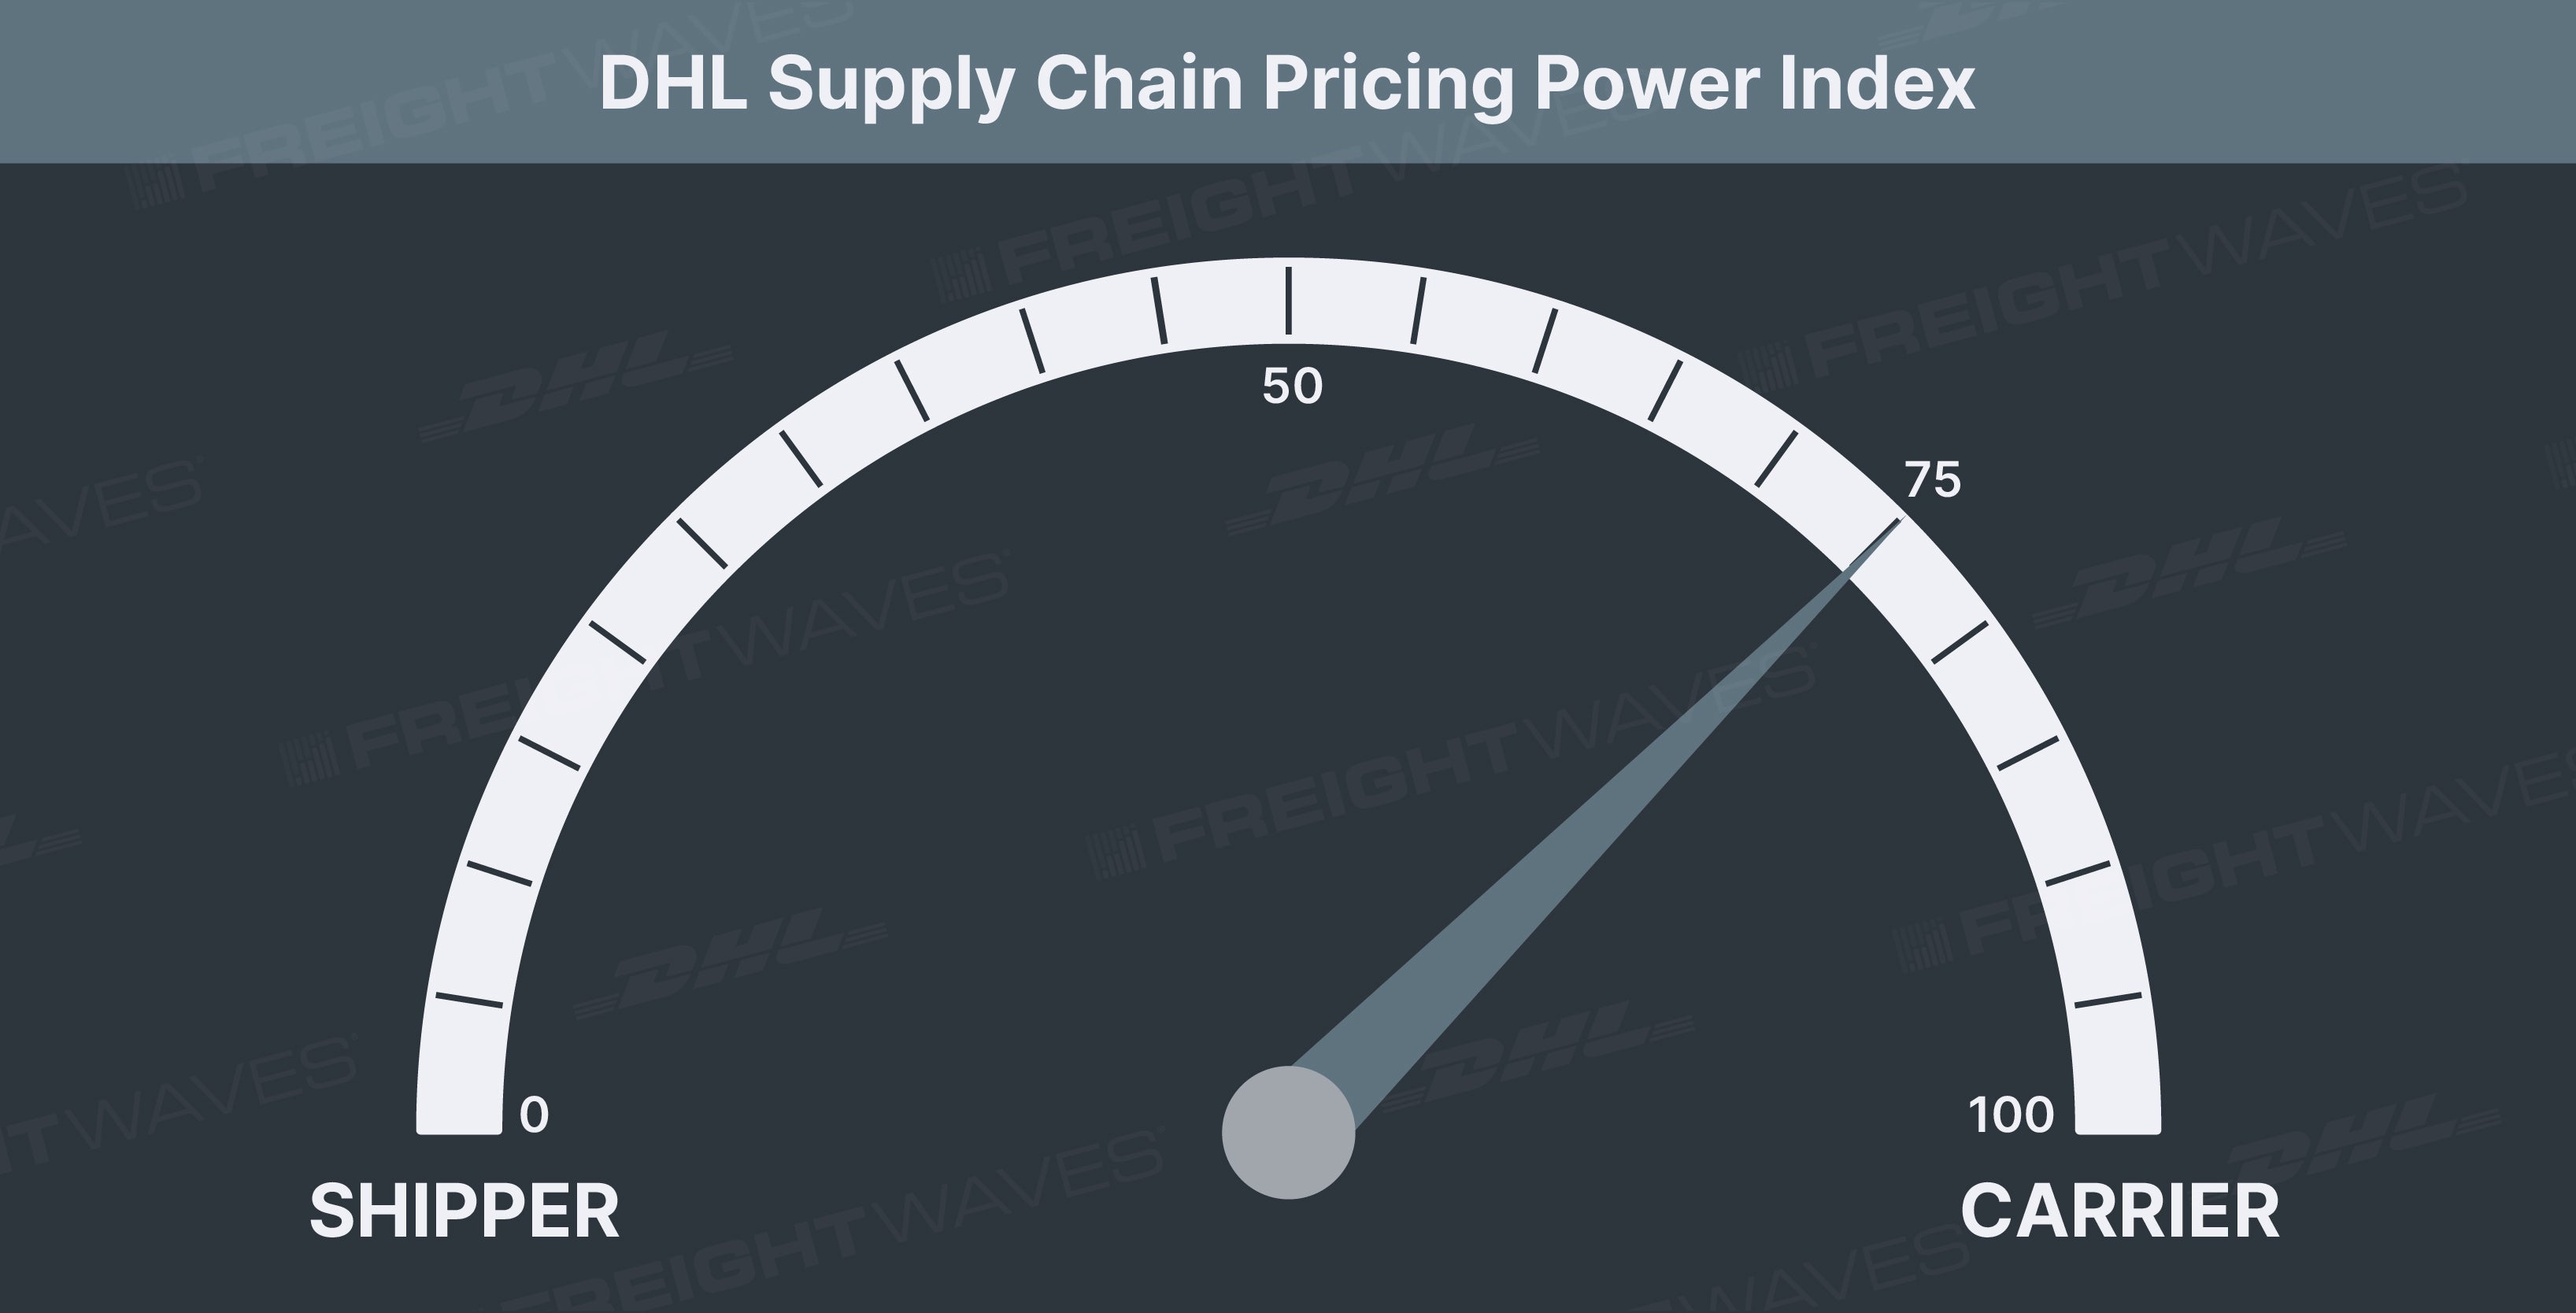
This week’s DHL Supply Chain Pricing Power Index: 75 (Carriers)
Last week’s DHL Supply Chain Pricing Power Index: 75 (Carriers)
Three-month DHL Supply Chain Pricing Power Index Outlook: 80 (Carriers)
The DHL Supply Chain Pricing Power Index uses the analytics and data in FreightWaves SONAR to analyze the market and estimate the negotiating power for rates between shippers and carriers.
The Pricing Power Index is based on the following indicators:
Load volume momentum slows, still positive heading into peak season
The Outbound Tender Volume Index (OTVI), shippers’ requests for capacity, continues last week’s downward slide. OTVI is now at the lowest level since the beginning of August as tender volumes fall below the 15,500 mark. During the past week, the tender volumes are down 2.65% week-over-week (w/w). Even with the pullback during the past two weeks, tender volumes are still running up over 2% year-over-year (y/y).

SONAR: OTVI.USA: 2021 (blue), 2020 (purple) and 2019 (green).
To learn more about FreightWaves SONAR, click here.
The downward trend to start the fourth quarter is standard, even in volatile times within freight markets. October is sandwiched between September, a month where shippers cause an increase in freight volumes as they try to move freight off their docks, and November, when an influx in freight volumes lead into peak season surrounding the holidays. Compared to 2020, the pullback in tender volumes is nearly the same, falling by roughly 5% from the end of September through the first two weeks of October.
OTVI, which includes accepted tenders and rejected tenders, signals that shippers are still sending out tenders at a rapid pace, even though OTVI is off the all-time high. Adjusting OTVI by the tender rejection rate aids in painting a picture of accepted freight volumes moving through networks. The accepted tender volumes did pull back by 2% over the past week as rejection rates continued the downward slide as well. Even with the pullback in accepted tender volumes, volume levels are maintaining the gap with year-ago levels. Accepted volume levels continue to run up over 7.5% y/y, likely to increase in the coming months.
Import demand continues to drive truckload demand, especially in port markets. Import levels as reported by U.S. Customs spiked this week, continuing to run at peak season levels. There are signals that maritime demand is slowing slightly as container spot rates and ocean bookings from China to the U.S. have declined over the past week. The congestion at the ports will continue to keep the pressure on the truckload market as intermodal networks continue to work through their own sets of issues.
The congestion in the ports, notably at the ports of Los Angeles and Long Beach, is driving an emphasis on transloading as the ongoing decline in loaded international intermodal container volumes out of Los Angeles persists. This emphasis on transloading is leading to a slight uptick in tender volumes in both Los Angeles and Ontario but really showing up in Truckstop.com’s load board volumes. On the 8 outbound LAX lanes, all 8 are up over 100% y/y, with Los Angeles to Dallas running up a remarkable 1,000% y/y.

SONAR: OTVIW (color) and OTMS (height).
To learn more about FreightWaves SONAR, click here.
Across the country, 87 of the 135 markets tracked by FreightWaves SONAR were lower over the past week. The largest markets that are near ports all experienced increases over the past week, while the large interior markets experienced with the exception of Memphis, Tennessee.
Ontario and Los Angeles both experienced tender volumes picking up during the past week, rising 2.9% w/w and 4.8% w/w, respectively. The increases in the markets bring freight volumes to just shy of the all-time highs in the market, so it is likely that there will be a new all-time high in the coming months. Ontario continues to solidify itself as the largest market in the country, representing 4.6% of all outbound freight in the country and Los Angeles representing 2.9% of outbound freight.
Atlanta, Dallas and Harrisburg, Pennsylvania, the three largest interior markets, all posted significant decreases in tender volumes over the past week. Tender volumes in Atlanta pulled back by 1.8% w/w while in Dallas and Harrisburg tender volumes fell by 4.3% and 11.3% w/w, respectively.
By mode: Reefer tender volumes, as represented by the Reefer Outbound Tender Volume Index (ROTVI), fell similarly to the overall volume index, down 2.25% w/w. The pullback is the second pullback in reefer volumes in the past three weeks. Reefer volumes continue to underperform last year’s level, down 6.66% y/y.
Dry van volumes were down essentially the same as reefer volumes, falling 2.24% over the past week. The pullback over the past week has brought dry van volumes in line with last year, down just 0.23% y/y. As we enter peak season, dry van volumes will continue to climb during the final two months of the year.
The overall outlook for freight volumes in the final quarter of 2021 is strong, likely to lead to a continued melt-up in freight rates moving through the rest of the year
Shippers driving improved carrier compliance through higher rates
The Outbound Tender Reject Index (OTRI), a measure of relative capacity in the market, continues the downward slide that started at the end of September. Over the past week, OTRI fell by 48 basis points (bps) to 20.92%. The most recent reading is the lowest rejection rates have been since early August.

SONAR: OTRI.USA: 2021 (blue), 2020 (purple) and 2019 (green).
To learn more about FreightWaves SONAR, click here.
OTRI traditionally falls throughout October, even when the freight market is loose like in 2019. The pullback in rejection rates during the past week, brings the total pullback in October to 77 bps so far, just 10 bps less than in 2020. Relative capacity traditionally starts to tighten in early November, which is likely to happen again this year as increased freight volumes are going to lead to higher rejection rates.
Higher contract rates are aiding in increased carrier compliance and lower rejection rates compared to a year-ago. Rejection rates are currently down 410 y/y, which is narrower than the gap was last week.
While rejection rates are sliding, Outbound Tender Lead Times, a measure of shippers’ confidence in securing capacity, are lengthening. Lead times are roughly 7% longer than they were a year-ago and the longest they have been outside of holiday impacted weeks. Lead times and rejection rates can move in opposite directions especially when the number of loads that are being retendered is decreasing, like what is currently happening. Shippers are having to put tenders out further in advance of the pick up date to secure the necessary capacity, contributing to the longer lead times. When rejection rates are increasing, lead times decline as loads have to be tendered more often, driving lead times down.

OTRIW (color) and OTMS (height).
To learn more about FreightWaves SONAR, click here.
Relative capacity did loosen across the majority of the country over the past week as rejection rates fell in 79 of the 135 freight markets.
The West, Northeast and Mountain Prairie regions were the only regions that tightened over the past week, increasing 20 bps, 14 bps and 74 bps respectively. The capacity situation in the West region’s largest markets, Ontario and Los Angeles was largely unchanged over the past week as rejection rates were flat w/w, sitting at 17.38%. Rejection rates in Ontario are still down by 600 bps y/y, which signals that the capacity situation has improved slightly, though it is likely heavily influenced by the increase in rates out of Southern California.
In the Northeast, Elizabeth, New Jersey, rejection rates increased by 200 bps w/w in the port market. The increase over the past week brings rejection rates up over 480 bps higher than they were last year. As increased import volumes into the port of New York/New Jersey, pressure on the capacity situation will remain throughout the rest of the year, given the proximity to large consumption centers.

To learn more about FreightWaves SONAR,click here.
By mode: Reefer rejection rates fell by 134 bps over the past week but remain the highest of the three equipment types within SONAR. Reefer rejection rates are lower than they were a year ago by more than 600 bps. As the temperature-controlled market starts to turn on ahead of the holiday season and the winter months, shippers will still have difficulty securing capacity.
Dry van rejection rates moved the smallest amount over the past week, pulling back just 39 bps w/w. Van rejection rates have continued the downward trend established around Labor Day. Ultimately, van capacity will come under pressure again as the holiday season approaches and intermodal moves are no longer viable.
The flatbed market suffered a correction over the past week, erasing nearly all of last week’s increase. Flatbed rejection rates have pulled back to 24.62%, a 330 bps collapse over the past week. The market is the smallest within the dataset and is the most volatile due to the size of the dataset. The tightness within the flatbed market isn’t going to dissipate as the industrial economy continues to recover.
Barriers to entry in the truckload market are at the seemingly highest level as used equipment prices have soared. The average used three-year old class 8 truck costs over $90,000, according to ACT Research. The COVID-19 pandemic has hampered truck manufacturing meaning equipment turnover isn’t as fast, starving supply from the used truck market while demand for trucks for owner-operators and small fleets is increasing.

To learn more about FreightWaves SONAR,click here.
The increases in used truck prices, as well as soft truck transportation employment numbers compared to pre-pandemic levels, will continue to keep a lid on capacity into 2022.
Inflationary pressure on freight rates dissipates slightly
The spot rate data available in SONAR from Truckstop.com is updated at a 10-day lag.

SONAR: TSTOPVRPM.USA (blue, right axis); VCRPM1.USA (orange, left axis)
To learn more about FreightWaves SONAR,click here.
Truckstop.com’s national spot rate, which includes fuel surcharge and other accessorials, fell by 5 cents per mile over the past week to $3.48/mi. The pullback in spot rates was the equivalent to last week’s increase. Of the 102 lanes from Truckstop.com’s load board, 32 reported increases last week, with outbound Los Angeles becoming increasingly expensive, as spot volumes increased.
The national spot rate finally joined both tender volumes and rejection rates, pulling back last week. Given freight volumes and rejection rates pulled back again this week, it is likely that spot rates will suffer another drawdown next week. The national spot rate is still well above last year’s level, running up 18% y/y.
Dry van contract rates did pull back in the most recent week by 2 cents per mile to $2.70. Dry van contract rates, which are reported on a two-week lag, are off the all-time high set in mid-September. Expect that contract rates will see a slight upward move in the next two weeks, following the move spot rates experienced last week.
Contract rates, which are just the base linehaul rate, excluding fuel surcharges and other accessorials that are included in spot rates, have closed the gap with spot rates significantly over the past year. Contract rates continue to run up 20% y/y and likely face more upward pressure heading into 2022.
Ultimately, upward pressure on freight rates is likely to remain in place for at least the next six months and beyond as supply chain constraints continue to be worked through.
For more information on the FreightWaves Freight Intel Group, please contact Kevin Hill at [email protected] or Andrew Cox at [email protected].
Check out the newest episodes of our podcast, Great Quarter, Guys, here.