


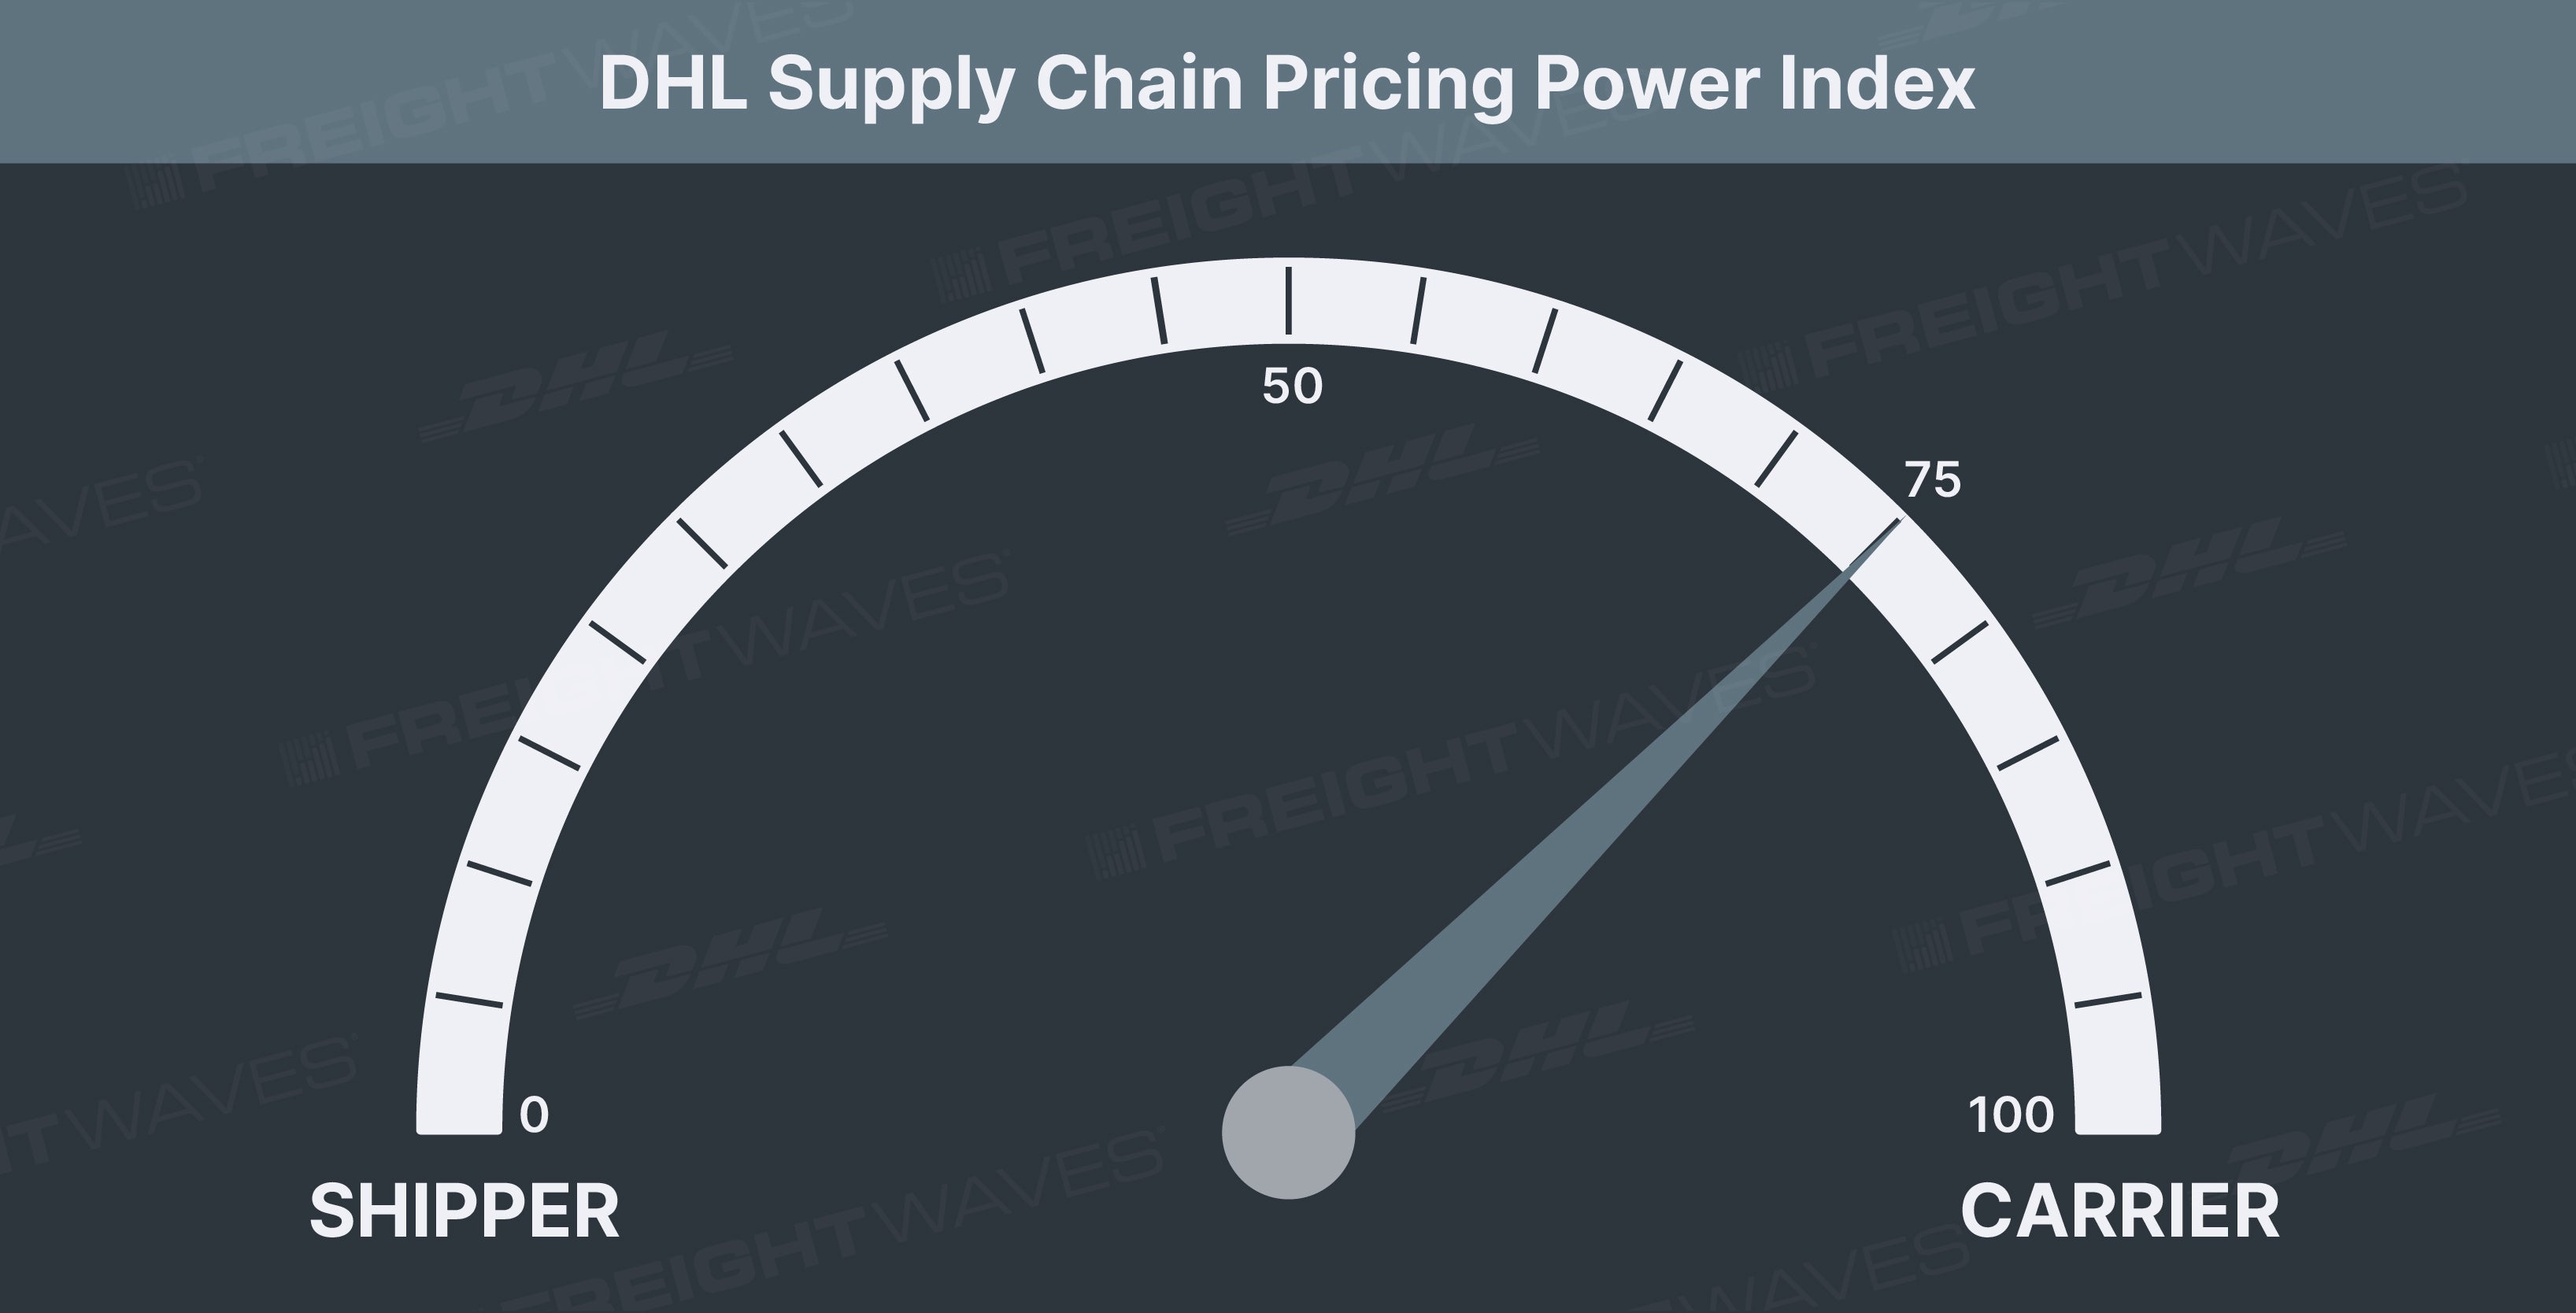
This week’s DHL Supply Chain Pricing Power Index: 75 (Carriers)
Last week’s DHL Supply Chain Pricing Power Index: 75 (Carriers)
Three-month DHL Supply Chain Pricing Power Index Outlook: 75 (Carriers)
The DHL Supply Chain Pricing Power Index uses the analytics and data in FreightWaves SONAR to analyze the market and estimate the negotiating power for rates between shippers and carriers.
The Pricing Power Index is based on the following indicators:
Load volume momentum slows but still strong compared to 2020
The Outbound Tender Volume Index (OTVI), shippers’ requests for capacity, erased last week’s positive momentum as tender volumes slid. OTVI has dipped back below the 16,000 mark, pulling back by 1.5% week-over-week (w/w). As it stands now, absolute tender levels are up just 2% year-over-year (y/y).
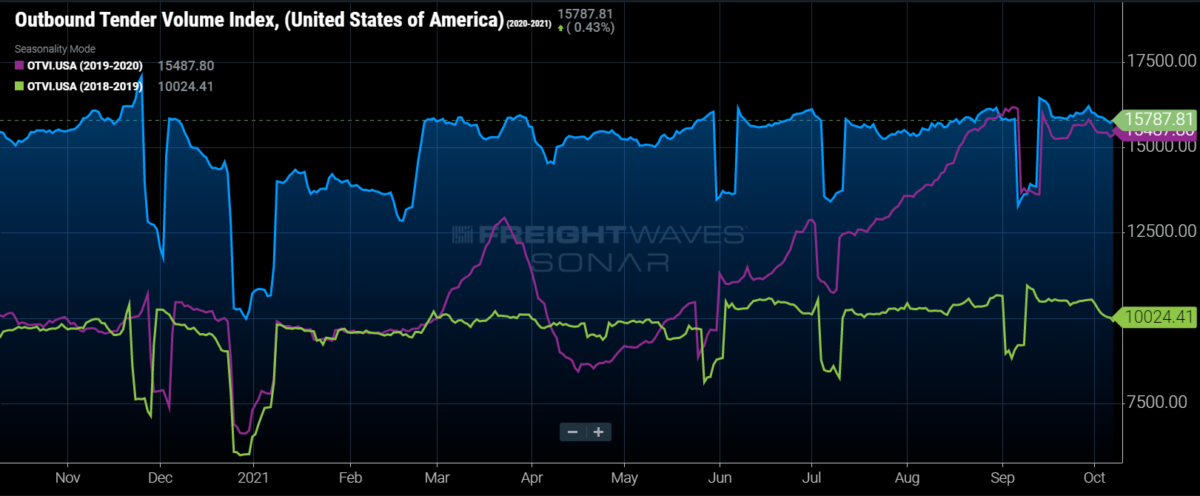
SONAR: OTVI.USA: 2021 (blue), 2020 (purple) and 2019 (green)
To learn more about FreightWaves SONAR, click here.
The pullback to kick off the fourth quarter is a traditional trend that OTVI experienced during the two prior years, though the levels were drastically different. The pullback to start the quarter is standard as freight volumes ramp up into the close of the third quarter as shippers attempt to move goods off their docks. October is traditionally a stable month before volume levels grow into the peak holiday season during November.
OTVI, which includes accepted tenders and rejected tenders, signals that shippers are sending out more tenders to carriers than ever before. Adjusting OTVI by the tender rejection rate aids in painting a picture of accepted freight volumes moving through networks. The accepted tender volumes did pull back by 1% over the past week, erasing all of last week’s gain. Even with the pullback in accepted tender volumes, volume levels have expanded with the gap y/y. Accepted volume levels are running up over 10% y/y, the widest it has been (non-holiday-influenced) since early August.
Increased import demand compared to a year ago is setting up freight volumes to continue to climb through the rest of the fourth quarter. Import shipments have consistently held on to peak-season levels throughout the entire year, and ocean bookings from China destined for U.S. ports set a new all-time high just a couple of weeks ago. That is likely going to further add to the congestion in San Pedro Bay but also put pressure on spot volumes out of Los Angeles as shippers bypass the contract market, both truckload and intermodal. Los Angeles spot volumes have exploded over the past year, with all of the lanes, according to Truckstop.com, leaving LA up over 100%, with the exception of Los Angeles to Las Vegas, which is up 81%.

SONAR: OTVIW (color) and OTMS (height)
To learn more about FreightWaves SONAR, click here.
Across the country, 81 of the 135 markets tracked by FreightWaves SONAR were lower over the past week. The largest markets in the country were a mixed bag, with the two largest markets in the country, Ontario, California, and Atlanta, pulling back significantly, falling by 3.2% and 4.8%, respectively. Los Angeles freight volumes were down even more than the neighboring Ontario market, falling by 8.3% w/w.
Not all of the largest markets experienced a pullback in tender volumes. Two of the three largest freight markets in the Northeast, Harrisburg, Pennsylvania, and Elizabeth, New Jersey, experienced volume growth in the past week as tender volume levels grew by 3.9% and 1.6% w/w.
The Chicago freight market has been one of the most volatile in the country, especially compared to the other large freight markets. After freight volumes were down over 3% last week, that reversed course this week as freight volumes grew by 11.7% w/w.
By mode: The reefer volume breather was short-lived as volumes grew by 6% over the past week. The recent increase brings the Reefer Outbound Tender Volume Index (ROTVI) to the highest level since early April. Volume levels in the largest reefer market at the moment, Twin Falls, Idaho, have been growing steadily since early August. In the past week, reefer volume levels in Twin Falls increased by 28%.
Dry van volumes are picking up where reefer volumes left off last week as volumes pulled back by 1.6% w/w. Comparing volumes to a month ago, volume levels are artificially inflated due to the Labor Day holiday impact, up 17.6% m/m. Ahead of the holiday-impacted volume inflation, dry van volumes were running up by roughly 3% m/m.
The overall outlook for freight volumes in the final quarter of 2021 is strong, likely to lead to a continued melt-up in freight rates moving through the rest of the year.
Relative capacity loosens to kick off Q4
The Outbound Tender Reject Index (OTRI), a measure of relative capacity in the market, continued the downward slide that started in the middle of last week. Over the past week, OTRI fell by 38 basis points (bps) to 21.48%. The most recent reading is the lowest rejection rates have been since the middle of August.

SONAR: OTRI.USA: 2021 (blue), 2020 (yellow) and 2019 (green).
To learn more about FreightWaves SONAR, click here.
OTRI is moving in an opposite direction from last year, when rejection rates were relatively volatile around the 25% mark. Rejection rates in 2021 have been below the 25% mark since the Fourth of July holiday. Even though relative capacity appears to be looser than a year ago, conditions are still quite difficult for shippers that are having to secure capacity in the open market.
Even though rejection rates are still extremely elevated, especially compared to 2019 levels, rejection rates are over 515 bps lower than year-ago levels. This signals that contract rate increases (up over 25% y/y) have aided in driving carrier compliance but securing capacity is still extremely difficult.
Traditionally, OTRI tracks the spot market closely, signaling when rates and loadboard volumes could increase. The potential shift of shippers going directly into the spot market, avoiding the contract market altogether, to ensure freight is moving is going to keep inflationary pressures on spot rates, but there could be some divergence in spot rates and rejection rates in the short term.
Overall, the capacity constraints in the market are still difficult for shippers to secure necessary capacity even with elevated rates. Those constraints aren’t going to go away quickly, and any easing will have to be led by the demand side of the equation first.

SONAR: WRI.
To learn more about FreightWaves SONAR, click here.
Relative capacity did loosen across the majority of the country over the past week as rejection rates fell in 86 of the 135 freight markets. The map above shows the Weighted Rejection Index, which is the product of the Outbound Tender Reject Index-Weekly change and Outbound Tender Market Share. The WRI is used to show which markets are tightening or loosening the fastest relative to the size of the market.
The map highlights markets like Kansas City, Missouri, that are loosening relatively fast based on the size of the market. Rejection rates in Kansas City did fall over the past week by 370 bps, to 25.11%. The market is still tighter than the overall market, but rejection rates are at the lowest level since mid-July. The pullback in rejection comes as freight volumes increased in the market, signaling that carriers were entering the market to service the influx in demand.
The largest markets did see muted increases in rejection rates over the past week. The largest market, Ontario, and neighboring market Los Angeles saw rejection rates increase by 38 bps w/w to 17.39%. Relative capacity in the markets is much looser than it was a year ago when rejection rates were above 26%. In Atlanta, rejection rates increased by 19 bps w/w, so capacity conditions in the market are very similar to last week.

To learn more about FreightWaves SONAR,click here.
By mode: Reefer rejection rates were the most stable of the equipment types over the past week, falling just 3 bps w/w. The most recent move is largely insignificant, just given the size and the fact that relative reefer capacity continues to be the tightest equipment type within the dataset. As the temperature-controlled market starts to turn on ahead of the holiday season and the winter months, shippers will still have difficulty securing capacity.
Relative dry van capacity loosened pretty significantly over the past week as VOTRI fell by 81 bps w/w. Van rejection rates have been trending down since Labor Day, but the most recent pullback was the largest move in three weeks. Ultimately, van capacity will come under pressure again as the holiday season approaches and intermodal moves are no longer viable.
The flatbed market is showing signs of life as rejection rates take another leg up. The Flatbed Outbound Tender Reject Index (FOTRI) jumped almost 500 bps in the past week, reaching the highest point since late June. FOTRI had largely been trending sideways for the past three months. The increase signals that there may be increased activity in the industrial economy, driving flatbed demand higher, causing a tightening of relative capacity for the flatbed equipment type.
Freight rates continue to face inflationary pressures
The spot rate data available in SONAR from Truckstop.com is updated at a 10-day lag.

SONAR: TSTOPVRPM.USA (blue, right axis); VCRPM1.USA (purple, left axis)
To learn more about FreightWaves SONAR,click here.
Truckstop.com’s national spot rate, which includes fuel surcharge and other accessorials, increased by 5 cents per mile over the past week to $3.53. Of the 102 lanes from Truckstop.com’s load board, 69 reported increases last week, with Chicago becoming increasingly expensive.
The national spot rate continues to climb through freight demand, and rejection rates suffered a slight pullback. That further signals that freight could be moving into the spot market, bypassing the contract market. The national spot rate continues to run up 20% y/y, signaling that the pullback two weeks ago was just a short-term hiccup and not indicative of future rate changes.
Dry van contract rates did pull back in the most recent week by 5 cents per mile to $2.72. Dry van contract rates, which are reported on a two-week lag, are off the all-time high set in the previous week. The slowdown in contract rates came two weeks after the slowdown in spot rates, which was expected based on how the contract rates are reported.
Contract rates, which are just the base linehaul rate, excluding fuel surcharges and other accessorials that are included in spot rates, have closed the gap significantly. Contract rates are now up over 25% y/y and likely to continue to climb through the rest of the year.
Ultimately, upward pressure on freight rates is likely to remain in place for at least the next six months and beyond as supply chain constraints continue to be worked through.
For more information on the FreightWaves Freight Intel Group, please contact Kevin Hill at [email protected] or Andrew Cox at [email protected].
Check out the newest episodes of our podcast, Great Quarter, Guys, here.