


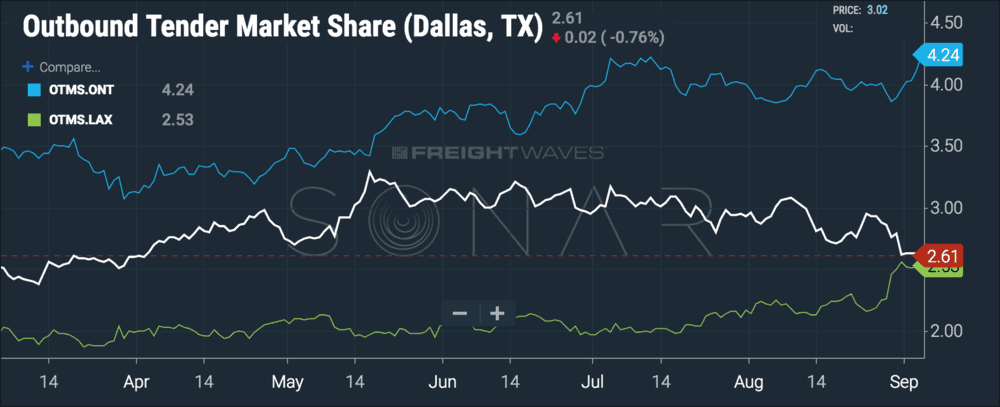
Since August 1, Dallas’ market share of tendered freight volumes (OTMS.DAL) has fallen by 11%, while Los Angeles (OTMS.LAX) and the distribution center-heavy Ontario market (OTMS.ONT) grew 17.3% and 6.9%, respectively. Absolute tendered volumes outbound from Dallas (OTVI.DAL) fell 9.3% in the period from August 1 to just before Labor Day.
The Dallas freight market was overheated for most of 2018—we wrote in June that the Dallas freight market was leading the country—on strong spring and summer freight volumes, reflecting its location as a crucial entry point into the national network for freight coming out of west coast ports. But now the wave of summer freight, which includes commodities like apparel, beverages, furniture, grills, lawnmowers, and other tools, has percolated through retail supply chains and into consumers’ homes.
While the freight summer has been over for a month, the fall surge is right around the corner. Container rates from China to West Coast ports (FBX.CNAW) spiked to their highest level all year this week, $2,138 per FEU, up 45% since July 29. Los Angeles turndowns (the percentage of tendered loads rejected by carriers), SONAR code OTRI.LAX, have likely found their bottom and have started mounting a recovery, rising to 9.8% yesterday.
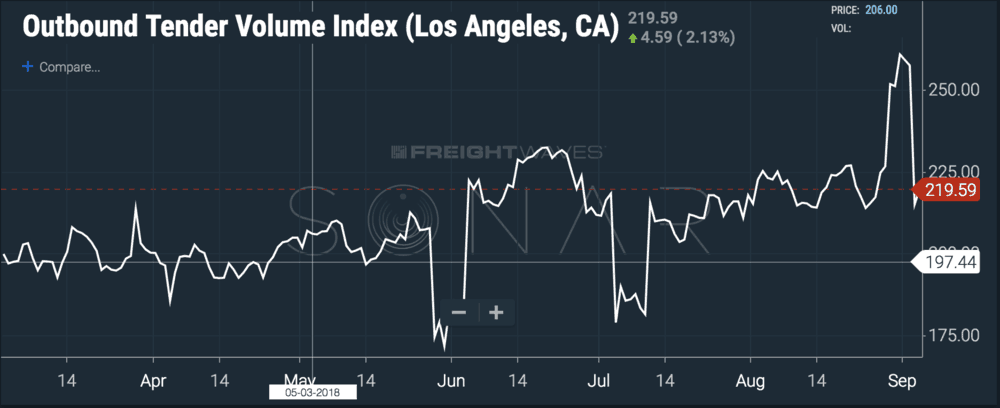
How do we know the summer surge is on? Los Angeles absolute tendered load volumes (OTVI.LAX) jumped 20% in the last week of August. The conventional wisdom would attribute the spike to shippers trying to cram their tenders in before the Labor Day holiday, but look at the chart below—there were no spikes before Memorial Day or July 4. That’s why we think the recent step change in LA volumes has more to do with seasonality and the approaching fall push than a temporary bump from anticipating a long holiday weekend:
This morning, Splash 24/7’s Sam Chambers reported that carriers were throwing extra capacity on the busy transpacific lanes, after they had successfully pumped the rates by removing capacity over the past few months.
According to DAT’s RateView tool, dry van spot rates from Los Angeles to Dallas trended downward since June, falling from $1.99/mile net of fuel to $1.78 in August, but have started to firm up: over the past seven days that lane has averaged $1.82 per mile. It’s important to remember that even in the midst of the summer doldrums, trucking rates are still a step change above where they were last year. In 2017, from August to November, the per-mile rate rose from $1.43 to $2.10 net of fuel.
