


This week’s addition of intermodal volume data to our SONAR platform brings us one step closer to having price, volume, and capacity for all modes of transport including air cargo, trucking, inland waterways (barge), ocean and rail. SONAR is truly a multi-modal near-time freight market dashboard, which now includes daily volumes for intermodal containers moving within and between freight markets in North America—including bi-directional container volumes between the U.S., Mexico and Canada.
SONAR will also display the inbound and outbound container volumes by both load status (empty/loaded) and length of the container (20’, 40’, 45’, 48’ and 53”) between major freight markets. This combined with weekly intermodal spot rates on 105 origin-destination pairings will give SONAR users an unprecedented view into the intermodal freight market.
In the U.S. Intermodal represents about 46% of all railroad traffic each week and for shippers, brokers, and carriers, it represents a competitively priced capacity alternative, especially in the long-haul freight sector where supply chain flexibility allows longer lead times. Intermodal also allows railroads, ocean carriers, trucking companies, and intermodal marketing companies (IMCs) to take advantage of the best attributes of various transportation modes from within SONAR to yield an efficient and cost-effective overall freight movement for customers.
How will SONAR user benefit?
SONAR’s intermodal tickers will also allow SONAR users to better understand the volume of containers:
- Moving between major freight markets in North America
- Shifting from rail to road as trailer-on-flatcar (TOFC) becomes economically less viable for Class 1 railroads
- international shipping containers moving by rail
- empty containers being repositioned due to freight imbalances between major intermodal markets such as Los Angeles and Chicago
- empty containers being shipped overseas to their port of origin due to international trade imbalances.
Road vs Rail or Road and Rail?
The two modes actually work very closely, especially in times of tight capacity, as witnessed in early 2018, intermodal transportation also provides additional capacity for asset-based carriers in both the 53-foot container and the trailer-on-flatcar (TOFC) sectors (SONAR: RTOIC.USA and RTOIT.USA), but we’ve witnessed a fundamental shift in the TOFC sector that may be here to stay. As truckload capacity increased in the last year, paper and spot rates dropped and long-haul outbound tender rejections (SONAR: LOTRI.USA) plummeted to just 4.45%, intermodal volumes in the TOFC sector are now down 16.68% year-over-year. Some of this is deliberate as railroads shed inefficient services through the Precision Scheduled Railroading (PSR) practice, but most of the shift is due to changes in supply and demand in the truckload sector. Economics also plays a major role as the evolution of the double-stack container well car yields a 35% to 45% overall efficiency improvement versus TOFC for railroads — two 53-foot containers can easily fit on a 65-foot well car whereas on an 85-foot rail flatcar you can only fit two 40-foot containers.
Intermodal volumes in SONAR opens up a view into global trade
The major benefit for SONAR users of daily intermodal volumes comes from a near-time view of international trade flows at major ports since intermodal volumes in SONAR also incorporate traditional 20 and 40-foot international shipping containers. The ongoing trade war with China is a great example of how this new data will quickly highlight both the shift in trade from the west coast to the east coast as well as the changes in truckload volumes as bigger and less-frequent vessels unload more freight at more ports along the Atlantic coast. In the chart below you can see the correlation between weekly intermodal outbound loaded 40-foot containers from Savannah (WORAIL40L.SAV) and the number of U.S. maritime import shipments (WCSTM.SAV) over the last year — the two data points are closely correlated.
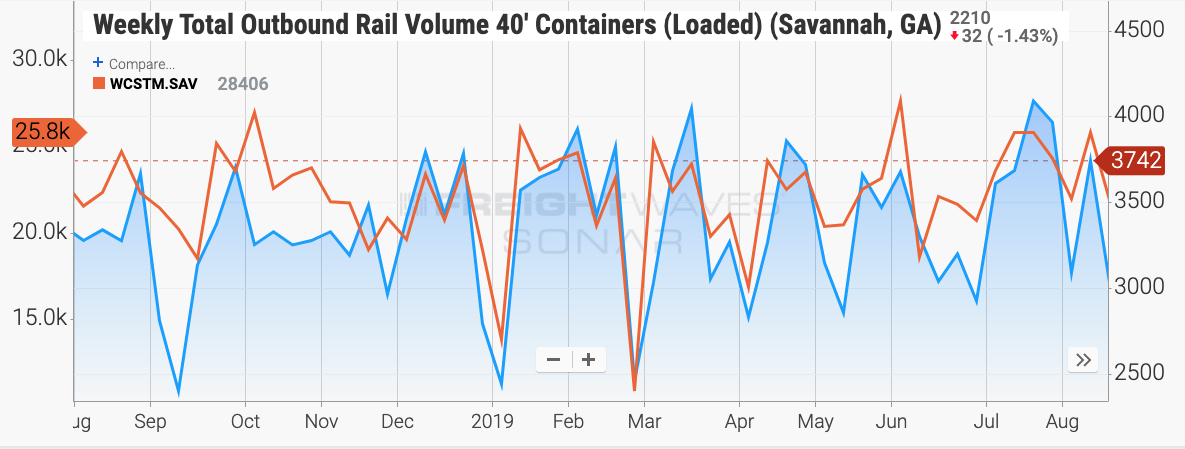
Intermodal volumes compared to customs import shipments (SONAR: WORAIL40L.SAV, WCSTM.SAV)
A similar pattern also exists when we compare truckload volumes (SONAR: OTVIM.SAV) to intermodal volumes (WORAIL40L.SAV) in Savannah given more imports will stay in their original 40-foot international shipping container for delivery compared to longer-hauls (typically 800-mile plus) where it makes sense to transship goods into a 53-foot intermodal container. Being able to connect daily volumes for both truckload and intermodal at the market level is unprecedented in the North American freight market.
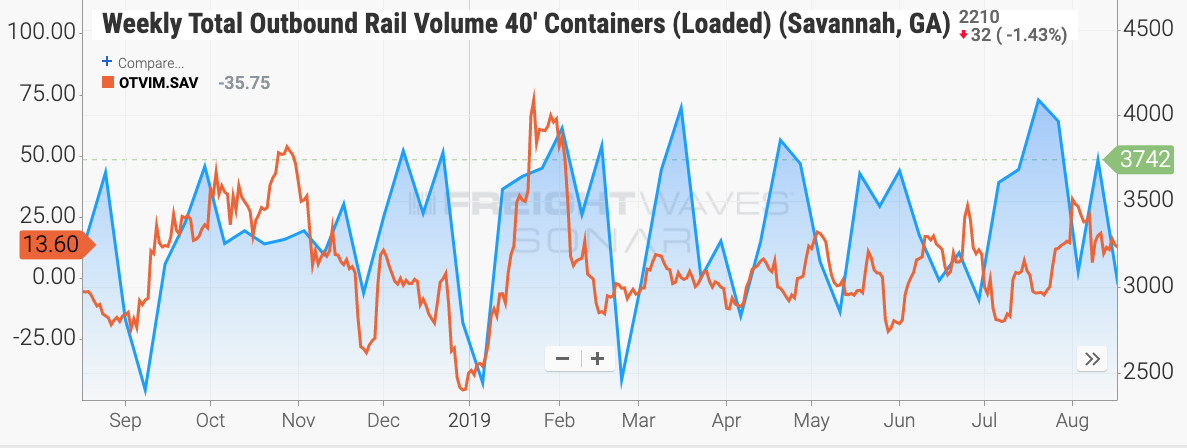
Intermodal volumes compared to truckload volumes in Savannah (SONAR: WORAIL40L.SAV, OTVIM.SAV)
The trade war with China shifts global trade flows
In the last six months, SONAR has recorded a shift in import volumes in favor of east coast ports as shippers have realigned their supply chains away from China to other countries in south-east Asia. As a direct result of the trade war with China, ocean carriers have been adding services to the east coast of the U.S. via the Suez Canal instead of the Panama Canal and in the process shifting more intermodal-bound volume to Atlantic ports.
In the month of August U.S. monthly customs shipment volumes have dropped 4% on the west coast through the ports of Los Angeles and Long Beach combined (SONAR: MCSTM.LAX) whereas on the east coast (SONAR: MCSTM.SAV) shipment volumes have risen 17% over the same time frame. This shift is now evident in SONAR’s new intermodal tickers, which show weekly outbound 40’ container volumes from New York to Chicago (WORAIL40L.EWRCHI) are up 57% year-to-date whereas on the west coast loaded outbound 40’ containers from Los Angeles to Chicago (WORAIL40L.LAXCHI) are up just 1% year-to-date. This is significant given the volume of intermodal containers on the Los Angeles to Chicago lane is one of the highest in the country.
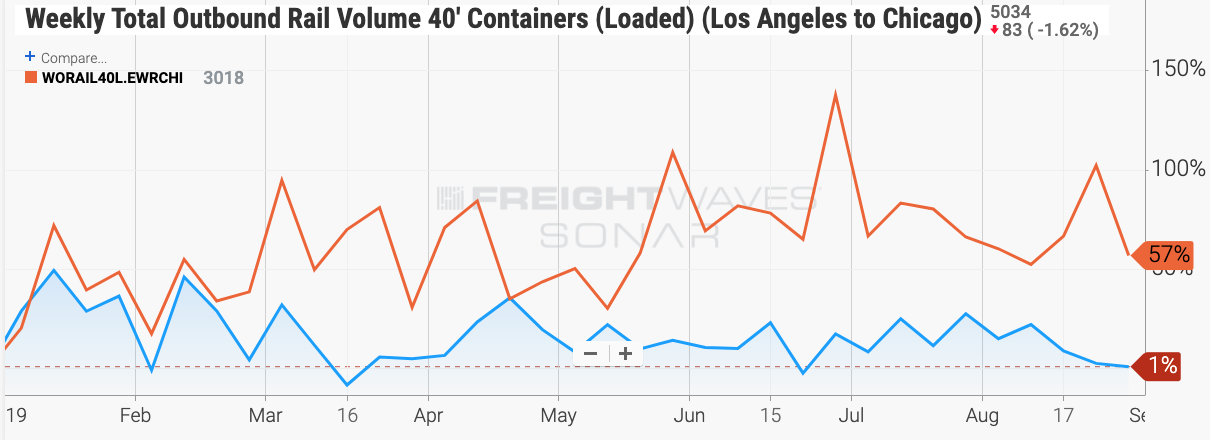
Intermodal volumes – east coast vs west coast (SONAR: WORAIL40L.LAXCHI, WORAIL40L.EWRCHI)
Another view of the same trade flow shift shows that since the massive pull-forward of freight from Asia to avoid the proposed Jan 1 tariff on Chinese imports, intermodal volumes on the Los Angeles to Chicago lane have shifted directions also. 20 and 40-foot container volumes are down 16% and 14% respectively while 53-foot intermodal container volumes have increased by 39%.
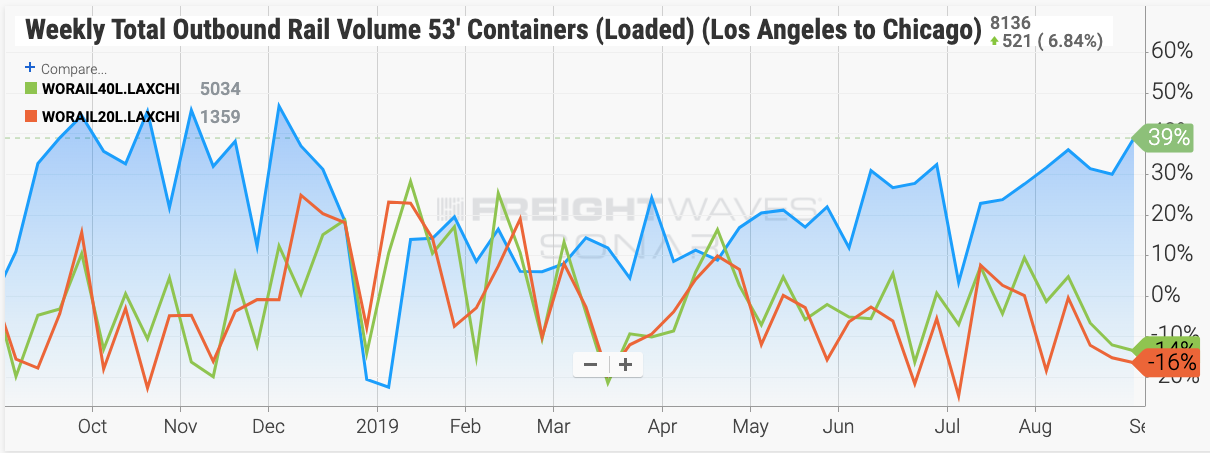
Intermodal volumes from Los Angeles to Chicago (SONAR: WORAIL53L.LAXCHI, WORAIL40L.LAXCHI, WORAIL20L.LAXCHI)
The increase in volume for 53-foot containers is most likely due in part to increased capacity in truckload resulting in more competition driving down spot rates on that lane (SONAR.INTRM.LAXCHI), which have averaged $1.18 per mile year-to-date. Over the same timeframe last year, spot rates on this lane were 23 cents per mile higher whereas this year the spread between intermodal and truckload spot rates have been in favor of intermodal for shippers.
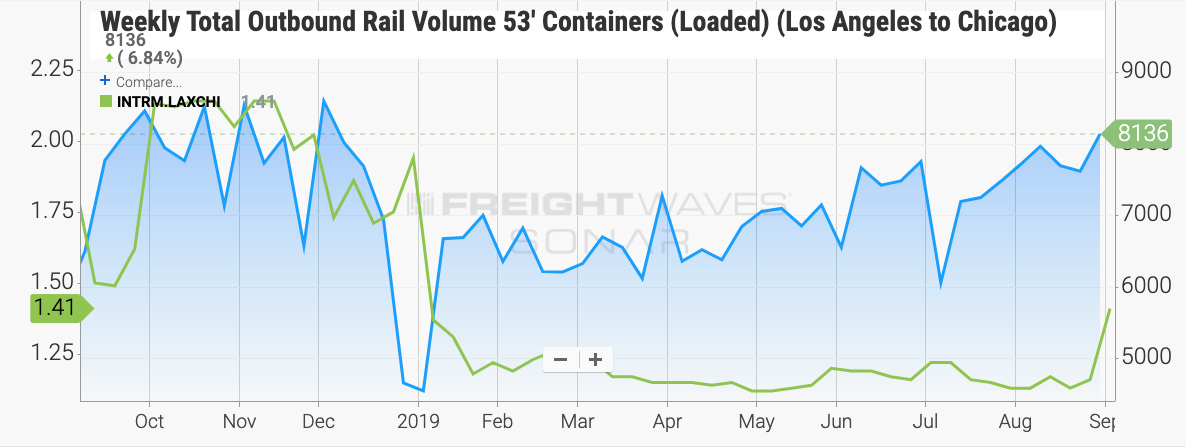
Intermodal volumes from Los Angeles to Chicago compared to spot rates (SONAR: WORAIL53L.LAXCHI, INTRM.LAXCHI)
These are just a few of the new insights you can generate from within the SONAR platform based on the new intermodal volume data just released, so stay tuned for more this week as we dig deeper into the intermodal freight market.