


Great news: the summer slump is over. We are calling the bottom. It’s all up and to the right for the rest of the third quarter and most of the fourth quarter. How are we so sure?
We are looking at hundreds of billion dollars of freight transactions from a multitude of sources ranging from freight payment and billing data, electronic transaction data, TMS data, telematics data, container prices, ULSD consumption data, used truck prices, DAT’s truckload spot index data, Cass’ shipment volume data, government data, and a multitude of other data sets. We believe we have assembled the most near-time map of the freight market. The great thing is we don’t rely on a single source of data or a single methodology on how to interpret the market– we use it all (some data sets are more valuable than others).
Anyways, here is what the data is telling us:
The bottom is in and the third quarter is going to be bangin’. In fact, in some of our simulation models, we believe truckload spot rates could see new record levels on specific lanes. What is interesting is that we don’t believe that all lanes will see new record levels, but specific sections of the market will. Today we are going to cover our fall spot market favorite in terms of the highest rips.
Go West! West is the best!
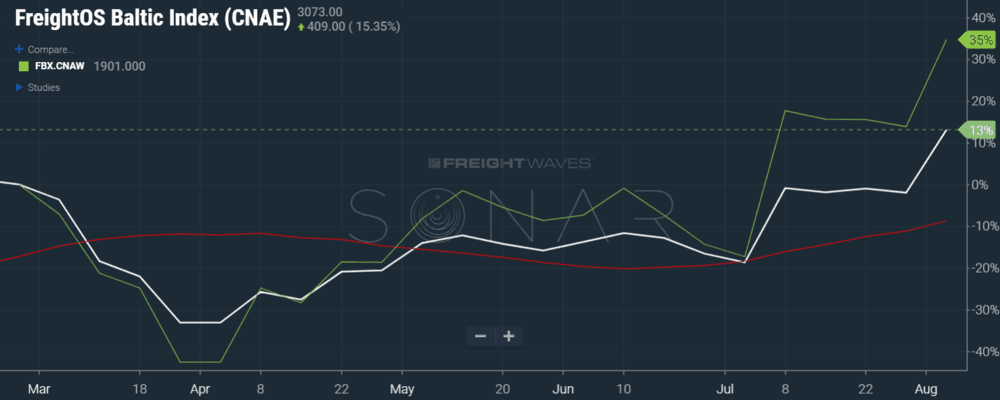
Our market data suggest the highest spot market rate increases will be found out West this fall. Container rates out of China to the North American West Coast have surged in recent weeks, up nearly 35% since February 25. In the same period, North American East Coast container rates have only surged by 13%. There are no signs that tariffs are impacting freight flows yet. We are also hearing from intermodal sources that there is no excess capacity available for the surge volume during peak out West, meaning that shippers could be forced to resort to the truckload spot market to buy capacity.
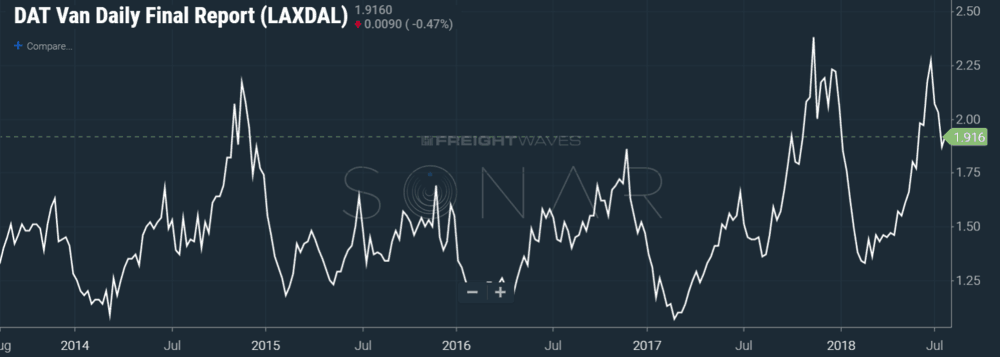
Other things that give us confidence in Pac 12 country: DAT truckload spot index rates.
Every July, spot rates fall from their June peaks in the Los Angeles to Dallas lane. Every. Single. Year. And it seems like every year truckers panic (we can be accused of having short memories, after all 83% of the industry is male). The reality is far more encouraging. Spot rates on this lane peaked at $2.27 a mile on June 29, 2018, dropping back to $1.84 on July 23, 2018. The lane is currently at $1.92 a mile. Our models show that $1.84 will be the bottom for that lane this year. We are expecting a super strong third and fourth quarter on this lane, with new records on the horizon. We have never broken $2.40 on this lane, but we think that is possible, if not probable. In fact, most models are showing a $2.50 break with an aggressive bull model showing $3.00 per mile (unlikely, but possible).
We are giving the spot market peak range on DAT’s Truckload Spot Index for Los Angeles to Dallas to be $2.32 to $3.08 a mile. We think the likely peak rate is around $2.62-2.67 a mile, to be seen the second week of November.
The other supporting evidence that the West coast is the place to be comes from looking at our other fundamental indicators: outbound tender volume index in Los Angeles has surged 12% since March 1.

The action is not just in UCLA country, we are seeing the Huskies benefit as well. Outbound tender volumes out of Seattle have surged 39% since March 1. This is an encouraging sign. The PNW usually saws logs 9 months out of the year only to wake up in October. This year, the slumber ended about 3 months early. Unfortunately, this volume has not impacted spot rates out of Seattle to any great degree just yet. That is probably two weeks out. The DAT Truckload spot rate Seattle to Los Angeles lane is currently sitting at $.86 per mile. We expect this to turn and are giving a spot range peak of $1.46 to $1.71 on the Seattle to Los Angeles lane.

If you are interested in gaining more near and real-time insights sign up for a SONAR subscription or visit MarketWaves18 where will be diving deep into the freight markets.
If you are interested in gaining insights with thousands of freight market charts and maps, sign up for a SONAR demo.
Stay up-to-date with the latest commentary and insights on FreightTech and the impact to the markets by subscribing.
