


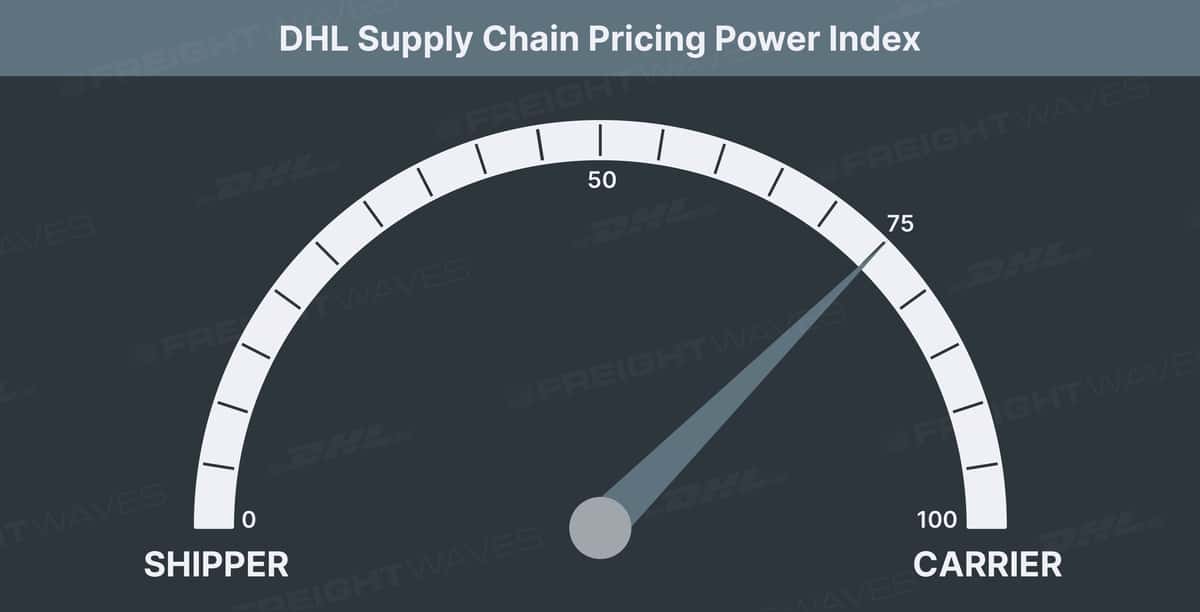
This week’s DHL Supply Chain Pricing Power Index: 75 (Carriers)
Last week’s DHL Supply Chain Pricing Power Index: 80 (Carriers)
Three-month DHL Supply Chain Pricing Power Index Outlook: 70 (Carriers)
The DHL Supply Chain Pricing Power Index uses the analytics and data in FreightWaves SONAR to analyze the market and estimate the negotiating power for rates between shippers and carriers.
The Pricing Power Index is based on the following indicators:
Load volumes: Absolute levels positive for carriers, momentum neutral
To learn more about FreightWaves SONAR, click here.
If you look at the weekly Outbound Tender Volume Index (OTVI) map above, you might think freight markets have reversed course and are retreating significantly. Here’s the OTVI weekly change for select major markets:
Ontario, California: -6%
Atlanta: -4.5%
Indianapolis: -7.5%
Harrisburg, Pennsylvania: -5%
Houston: -3.5%
Stockton, California -8%
But this line of thinking is misguided. Tender volumes are coming down, but off an unnaturally high base. The winter storms threw an already strained freight market upside down. Routing guides were upended as many major interstates — I-10, I-20, I-40, I-75, I-95, I-24, I-57, I-70 and I-80 — were all shut down for some time.
I believe the inability to source capacity at the beginning of March led retailers to accelerate their Q1 order schedule. So, coming out of the winter storms, shippers brought forward delivery schedules and caused an unnaturally large surge in tender volumes. It is this artificially high base from which the market is declining.
Tender volumes in nearly every major market in the country — from LA/Ontario on the West Coast, to Houston, Dallas and Atlanta in the South, to Joliet, Illinois, and Harrisburg in the Midwest and Northeast — remain above pre-storm levels.
The storm-induced tender volume surge was larger and longer-lasting than I had expected, but the market is reverting to the mean. If we look at the tender volume trend prior to the storm, volumes were at an extremely high level but were sliding. At the same time, tender rejections were declining as well.
Because OTVI is a measure of tender volumes, it is possible that OTVI can decline without a material decline in freight volumes. I believe this is playing out right now. The OTVI slide this week can be more attributed to a fall in tenders as routing guides are restored, rather than a decline in freight demand. This is evidenced by declining tender rejections and spot rates.
I am uncertain what the rest of March holds. There are two primary scenarios: 1. The down trend is reversed and volumes pick up as shippers look to offload inventory prior to the end of Q1, or 2. Volumes continue to slide through the end of the month because shippers pulled forward their end-of-Q1 pushes.
In any case, I do not expect wild volatility in either direction. OTVI has been flat on a national level since the winter storms hit, and I don’t anticipate this changing much over the next few weeks.

To learn more about FreightWaves SONAR, click here.
Tender rejections: Absolute levels positive for carriers, momentum neutral
Carriers continue to reject freight at a high level this week, with the Outbound Tender Reject Index sitting at 26.2%, down marginally from last week’s 26.5%. We’ve actually seen some volatility in major markets this week in both directions. Southern markets like Houston and Atlanta have seen a surge in tender rejections over the past 10 days, while Northeastern freight hubs like Harrisburg have seen significant declines.
In aggregate, the shifting freight networks balance out to very little change in the national average, but there are huge differences in capacity availability by region. In the Midwest and Plains regions, capacity is far scarcer than in the South and Southwest.
Since the beginning of the month, tender rejections have plummeted on the West Coast. However, much of this decline can be attributed to lower tender volumes, rather than additional capacity.

To learn more about FreightWaves SONAR, click here.
There has been more capacity volatility in March than in the months prior due to the winter storm disruption. I suspect we’ll see markets stabilizing in the coming weeks as contract rates continue to be solidified and routing guides fortified. Meanwhile, spot rates will continue to feel pressure to the downside.

To learn more about FreightWaves SONAR, click here.
Spot rates: Absolute level and momentum positive for carriers
The national dry van spot rate average fell slightly for a second straight week to $3.24/mile, inclusive of fuel. Spot rates peaked two weeks ago at $3.22/mile in the aftermath of the winter storms as shippers worked to clear freight backlogs.
Spot rates have peaked for this mini-cycle that was created by the winter storms. Of the 100 lanes available from Truckstop.com in SONAR, only a third were positive this week.

To learn more about FreightWaves SONAR, click here.
Contract rates are quickly being marked up toward spot rates. This should lead to downward pressure on tender rejections and spot rates as routing guides solidify. Spot rates will remain elevated if the current environment of high demand and relatively scarce capacity remains. There are catalysts including new truck orders and the ending of social distancing measures that will add capacity, but the question remains when and how much.

To learn more about FreightWaves SONAR, click here.
Economic stats: Momentum and absolute level neutral
Several economic releases this week are worth noting.
Weekly jobless claims were released Thursday and give us one of the best close-to-real-time indicators of the overall economy.
Jobless claims missed consensus estimates this week, a reversal from the recent momentum. Jobless claims were 770,000, which came in below the consensus of 700,000, and rose from 725,000 last week. On a positive note, there was good news in the form of continuing claims (a rough proxy for unemployment), which were roughly flat this week at 4.1 million but still notched a new low in the COVID era. The latest unemployment report from February was very encouraging (the U.S. economy added 379,000 jobs in February) and suggests the economic recovery is gaining steam from an employment perspective.
Initial jobless claims (weekly in 2020-21)

Turning to consumer spending as measured by Bank of America weekly card (both debit and credit) spending data, total card spending in the latest week available increased by 7.4% year-over-year. The picture is slightly less optimistic when focusing on retail spending excluding auto, which was up 2% year-over-year last week. Overall card spending decelerated modestly this week from last week’s 10.7%, which marked a pandemic high.
As we usually note, there has been an ongoing beneficial mix shift from cash to debit that is somewhat inflating these numbers. One can typically tell this is the case because debit card spending has been far outpacing credit card spending for the past year. However, in a significant change this week, credit card spending increased 8% year-over-year and outpaced debit card spending up 7% year-over-year. After consistently running deeply negative for months and being down precipitously in April, credit card spending does appear to have finally turned the corner.

The main takeaways this week are that we are nearing the one-year mark from when COVID-19 became widespread in the U.S., which is dramatically altering the one-year growth figures. For this reason, Bank of America has introduced the two-year growth figures (compared to the same time in 2019 pre-pandemic), which can glean more insight in most cases. Good examples of this phenomenon are how airline spending improved dramatically this week on a one-year basis and, in a change from recent trends, even the two-year comparison improved this week. Grocery, on the other hand, was the mirror opposite. Next week the one-year growth rate should jump significantly because it was the first week of major lockdowns in the U.S. and the effects of stimulus checks being disbursed should really start to show up. Lastly, restaurant spending is improving dramatically overall but is booming in states where COVID restrictions have been eased (e.g., Georgia and Florida) and not so great in states where restrictions are still more severe (e.g., California and New York).
By category, online electronics (up 53% year-over-year this week) and online retail (up 60%) continue to be the standout performers. However, the former two categories have slowed meaningfully from their monthslong blistering pace but have settled in at a very high level. Other strong categories include home improvement, furniture and department stores, which are on fire, rising by 60% year-over-year this week. Apparel sales are now up 41% year-over-year (and 9% on a two-year basis) The strong categories, as well as the weaker ones, have been remarkably persistent since the pandemic began, with the former weakening slightly and the latter improving gradually. We would note, however, that we expect a near-complete reversal and decisive change in terms of the winning and losing categories from a year-over-year growth perspective once a large number of Americans are vaccinated, likely sometime in the second or third quarter of 2021. We are already starting to see this phenomenon play out.
Card spending by American consumers has a strong correlation with truckload volumes, so we will continue to monitor this data closely going forward.

Source: Bank of America Securities
Transportation stock indices: Absolute levels and momentum positive for carriers
This past week was a good one overall for our transportation indexes. Logistics was the best performer at 1.7%, while LTL was the worst performer at -1.3%.


For more information on the FreightWaves Freight Intel Group, please contact Kevin Hill at [email protected], Seth Holm at [email protected] or Andrew Cox at [email protected].
Check out the newest episodes of our podcast, Great Quarter, Guys, here.
