


The seasonality of freight market volatility and/or volume has become as predictable as long term weather forecasts. Climatologically, we know January is going to be cooler than June in the U.S., but we don’t know how much cooler this January will be than the last one. The U.S. freight market has been much less volatile this October than 2017, even though we have seen similar but not equivalent events .
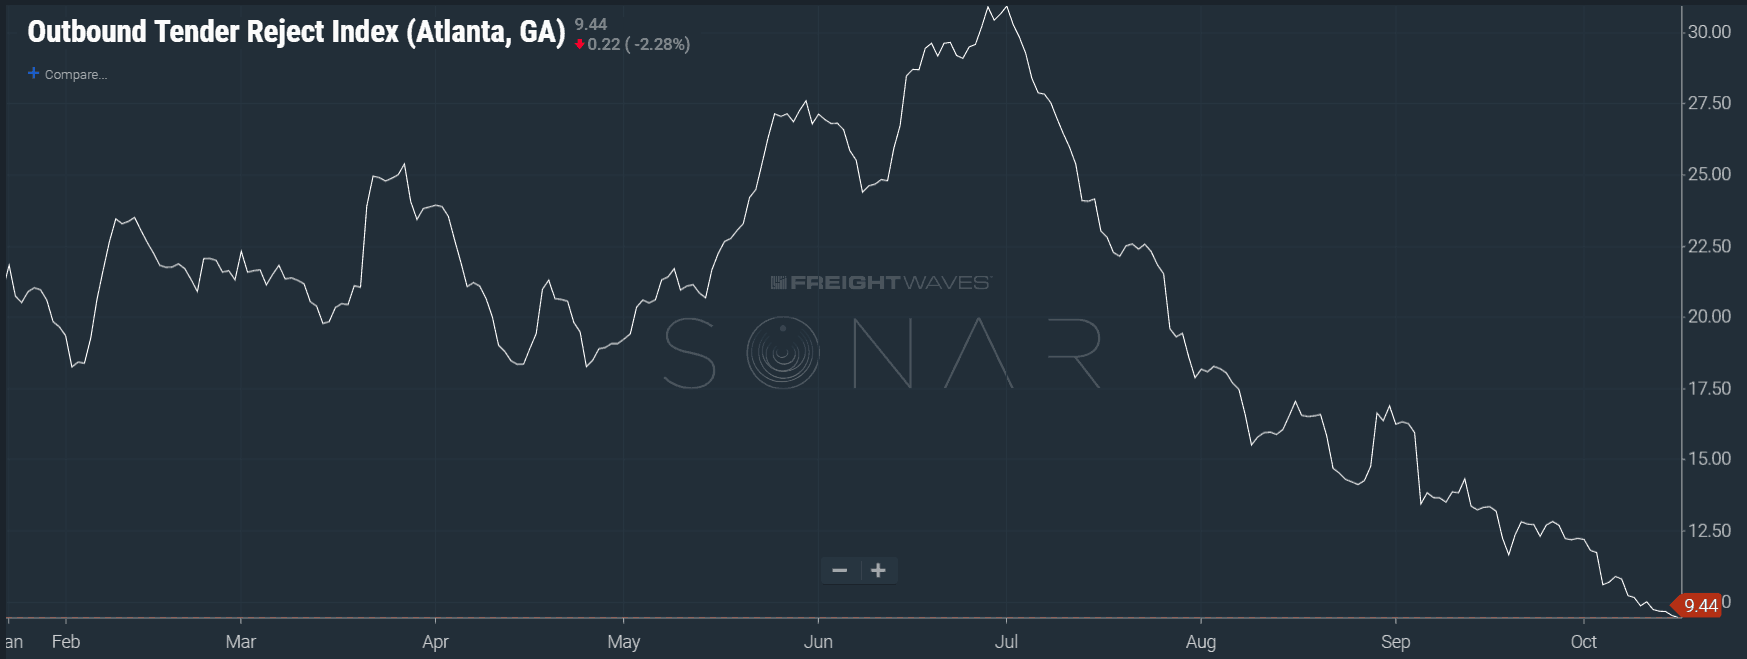
The outbound tender rejection index (OTRI) value for the largest market in the U.S. dropped to 9.44% today, hitting another annual low. To put it in perspective, this time last year OTRI.ATL was 21.14%. October of 2017 was a much more volatile time than we are seeing currently. Most people involved in transportation over the past few years would probably all agree that last October was the anomaly, as the economy was hitting its stride, and the U.S. had two major hurricanes, Harvey and Irma, hit the Gulf Coast.
So what makes this October so different? There have been two major hurricanes that hit the U.S. in the past month and the economy is still growing according to many indicators.
The obvious difference is in the areas directly impacted by the major land-falling hurricanes in 2017 versus the ones in 2018. Harvey and Irma have damage estimates around $130 and $85 billion respectively. Early estimates on this year’s hurricane damage has Florence around $50 billion at a high end and Michael, albeit very early, is sitting around $8 billion. Michael was the most intense of these four, making landfall as a category 4 hurricane with 155 mph winds, but appears to have the least amount of macro-economic impact.
In terms of the economy, the Institute of Supply Management’s Purchasing Managers Index (PMI) had a value of 60.2 in September of 2017 and 59.8 in September of 2018. The PMI is an index developed by a private organization that takes things like new orders, inventory levels, production, supplier deliveries and employment into account. A value over 50 is considered growing and a value under 50 is considered contraction compared to the previous month. The two Septembers are very close in value indicating a similar economic situation.
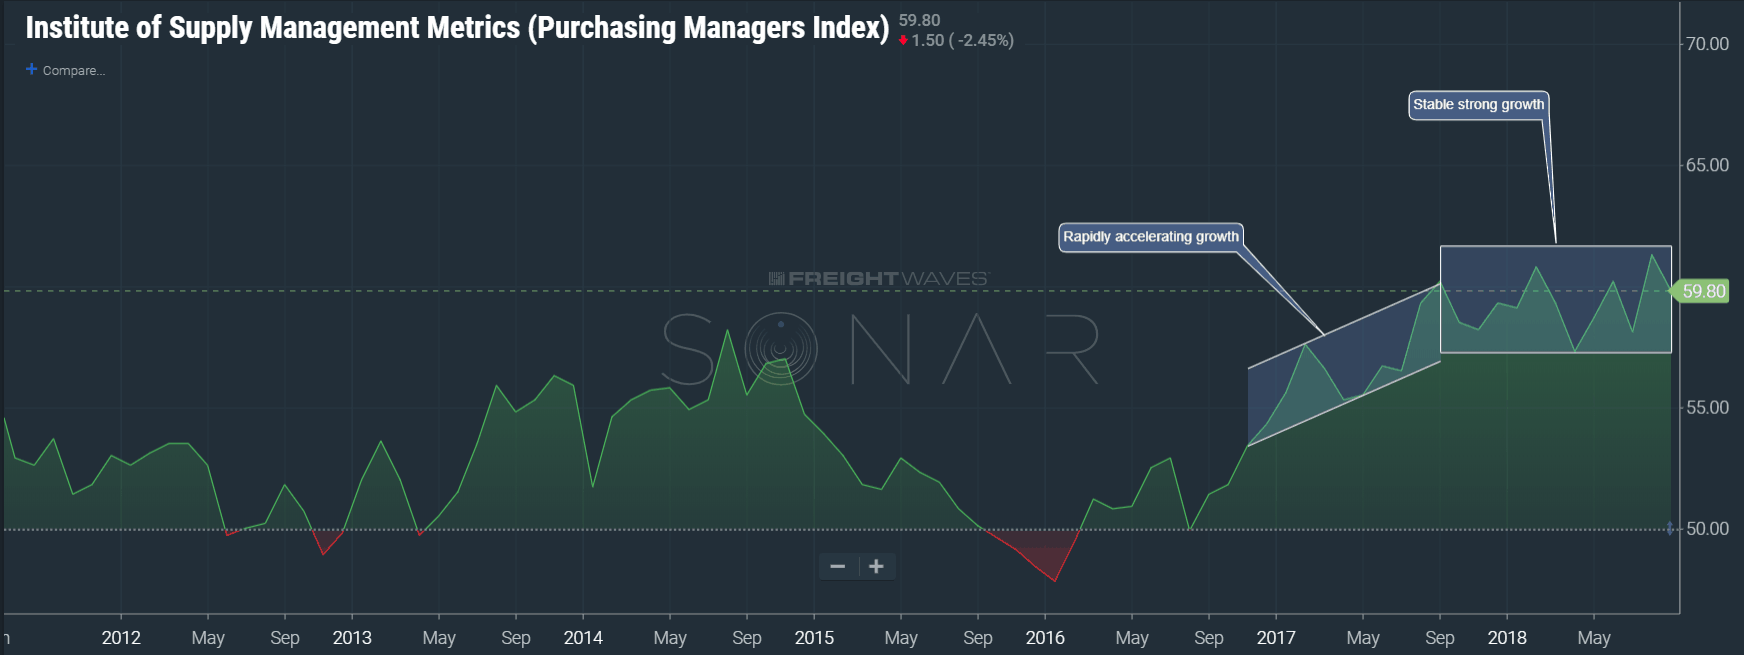
This year the economy has been showing strong growth signals for several months now, giving trucking companies time to adjust to the extended growth cycle whereas last year the surging production was relatively novel.
Rate increases that have taken place over the past 12 months and lower volumes over the past few weeks are currently driving stability in the market. According to DAT, contract rates have increased 16% over the past 12 months which would explain carriers’ willingness to stay within their contracts more often. Of note, tender volumes have averaged approximately 4.2% lower than late winter volumes so far this October. With the fall retail push on the horizon, we cautiously await the next big event in freight.
