
Freight markets have entered their second year of extreme dislocation, brought on by record consumer spending and a transportation network that doesn’t have the labor or equipment to fill the need.
A lack of openings on ocean sailing schedules, ships waiting longer to berth at the ports and delays unloading the freight once it has landed are some of the front-end issues facing the transportation industry. Once freight is routed inland, a chicken-and-egg scenario is playing out between container/chassis scarcity and slow rail service, with each causing further detriment to the other.
Add in labor headwinds throughout all phases of the supply chain, notably difficulties finding truck drivers and warehouse workers, and the storm for freight delivery is near perfect.
Inventory pull forward pushing inbound containers to new highs
The National Retail Federation said earlier this month inbound twenty-foot equivalent units would again break a recently established monthly record. The group is calling for August TEUs to increase 12.6% year-over-year at the nation’s largest retail container ports to 2.37 million, which would surpass the record just set in May.
“August is the beginning of the ‘peak season,’ when retailers stock up on holiday merchandise each year,” the report stated. “Many retailers are moving up their shipments this year as part of their risk-mitigation strategies to ensure that sufficient inventory will be available during the holidays.”
FreightWaves data shows inbound ocean bookings are accelerating again.

The NRF expects full-year 2021 TEUs of 25.9 million, 17.5% higher year-over-year and a new record. Monthly volumes are expected to remain above the 2 million-unit level for the rest of the year, continuously stepping lower from the August prediction to 2.02 million by December.
However, loaded imports came in lower than expected in July at the Port of Los Angeles due to congestion. Loaded inbound TEUs of 469,361 were light of the port’s expectation of 516,000. The port’s executive director, Gene Seroka, pointed to warehouses filled beyond capacity, maxed-out rail yards and difficulties finding chassis and containers as the culprits for the shortfall.
“Both anchorage and dwell times are trending in the wrong direction,” Seroka said. “Seventy-five percent of ships stopped at anchor in July [instead of heading to berth], up from 50% in June. Early data for August shows that 90% of arriving vessels are headed straight to the parking lot.”

As recently as mid-August, 125 ships were either at berth or anchor at the Los Angeles and Long Beach ports. That all-time high included 37 container ships.
Seroka’s update showed dwell time at container terminals was at peak levels (5.3 days), and street dwell time at the warehouses was near peak (8.3 days). Seroka estimates that for each one-day increase in dwell time, an additional 3,500 chassis are required.
He is calling for the port to handle a total of 950,000 TEUs in August, compared to 890,800 in July. Total TEUs are expected to step down to 880,000 in September with the full year producing 10.5 million in total throughput, a 14% increase from 2020.
“The cargo forecast remains strong through the balance of this year. This year’s peak [season] looks a lot like it has over the last 12 months: unrelenting consumer demand, imports competing for space and empties across the board,” Seroka said.
Container imports at the nation’s 10 largest ports increased 14.3% year-over-year in July, according to The McCown Report. July traffic was also up 12.3% compared to July 2019, a subdued but more normal freight market.
The NRF reported that retail container imports increased 35.6% year-over-year to 12.8 million TEUs during the first half of 2021. The bloated growth comp benefited from a sharp decline in freight demand at the pandemic’s onset as many sectors of the economy shut down or operated at reduced output levels for months.

Railroads dispute claims that poor service is tied to PSR
On the surface transportation side, many of the supply chain’s woes have been laid at the feet of the railroads. The railroads, however, are pushing back on the narrative.
At the Deutsche Bank (NYSE: DB) 2021 Transportation Conference, management from Union Pacific (NYSE: UNP) told investors that in addition to a huge influx of containers landing on the West Coast, a lack of capacity in the terminals was the reason for service issues. Jennifer Hamann, EVP and CFO, pointed to “things beyond our network” like shortages of drivers and chassis as the culprits behind trains being delayed.
“Dray capacity is still an issue,” Hamann said. “That very much is an issue on the international side in particular, but to a lesser extent on the domestic side. I would say the domestic issue … is more the chassis.” She pointed to roughly 2,000 containers still stuck in stacks because UP doesn’t have the chassis needed to put them into service.
In July, the railroad suspended international container movements from West Coast ports headed inbound to Chicago for one week to allow the network time to catch up. BNSF Railway (NYSE: BRK.B) made a similar decision to limit traffic.

At his monthly press conference, Seroka said UP had 25 miles of trains and BNSF had 22 miles of trains sitting outside facilities near Chicago at the time of the service pauses. He also noted that rail dwell time at the Port of Los Angeles has worsened to more than 13 days, which is a record.
UP’s intermodal volumes are down 5% year-over-year in the third quarter and down sequentially from the second quarter as well. Hamann said declines in parcels from an e-commerce surge a year ago are hurting the comp.
UP began recalling crews this year when volumes improved, but July Surface Transportation Board employment stats show the railroad’s employee count was down 2.8% year-over-year in the latest month.
The company ended the second quarter with just north of 30,000 full-time employees, its “lowest number of FTEs in the last 15 years,” and well off the 42,000 mark recorded in 2018. By comparison, average weekly volumes are down just mid-single digits compared to a 28% reduction in headcount over the same period.

In addition to volume declines, precision scheduled railroading and other efficiency initiatives have been the primary driver of the labor reduction. Management expects headcount to remain near current levels and said as volumes come back, it will add employees but not on a one-to-one basis.
Hamann said the objective is to build the most efficient rail network in North America while growing volumes. She said PSR efforts are not to blame for declining service on the railroads, noting that key performance indicators like miles per car and the percentage of boxes and cars arriving on time have actually seen mid-single-digit percentage increases from two years ago.
“PSR is going to support our ability to do those things, not hinder them,” Hamann added.
The company’s current guidance calls for 7% volume growth in 2021. Declines in recent weeks (total third-quarter volumes flat year-over-year but down mid-single digits sequentially) are clouding the path to the target. Improving auto production and agricultural shipments as well as improving intermodal fluidity are expected to bridge the gap “in the coming weeks.”
Rail service issues are far from isolated to UP and the West Coast.
Significant equipment and labor headwinds have been seen in the East Coast ports of New York and New Jersey as well as Savannah, Georgia, resulting in growing queues of late. Railroads have been diverting containers to inland intermodal terminals in efforts to increase capacity and address the congestion.
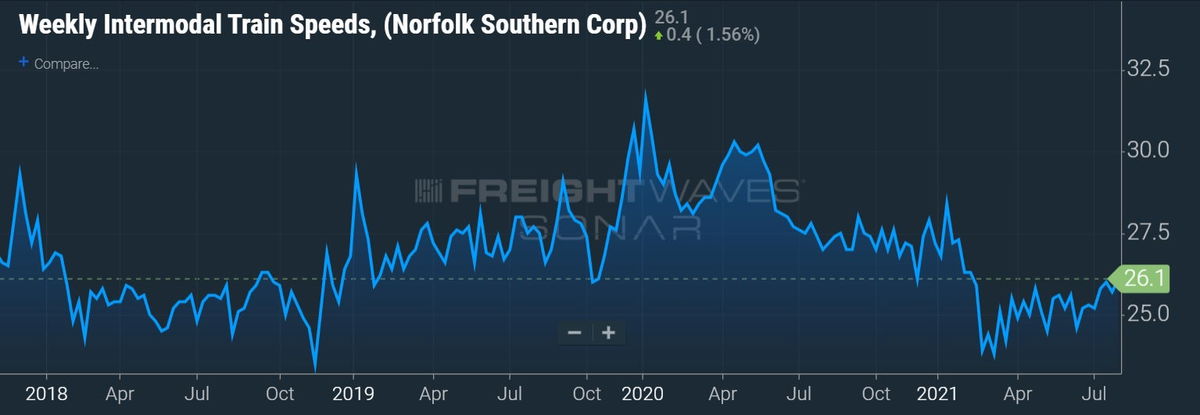
In a separate appearance at the Deutsche conference, management from Norfolk Southern (NYSE: NSC) said a repair program in place to address a defect on approximately 1,500 chassis has only exacerbated intermodal equipment shortages. The company will have 75% of the repair work done by the end of August and said it plans to begin taking delivery of an additional 1,100 chassis at the beginning of the year to address the shortfall.
The railroad was later than others to adopt a PSR initiative. However, since the launch of its TOP21 operating plan in the third quarter of 2019, it too has leveraged headcount. Gross ton miles per employee have increased 22% in that time.
J.B. Hunt is hopeful for improvement but not guiding to it
J.B. Hunt Transport Services (NASDAQ: JBHT) plans to take delivery of 3,000 to 4,000 intermodal containers during the third quarter (12,000 in total over time) to ease network congestion. However, the fix is unlikely to be meaningfully impactful in the near term.
Asked at the same conference if intermodal loads could be flat year-over-year during the third quarter, Brad Delco, VP of finance and investor relations, provided some caution. He said the midquarter additions would only add approximately 8,200 loads (assuming the recent monthly run rate of 1.65 loads per container) to the 500,000 it handled during the second quarter.
“Compare that to a year ago [530,000 loads], flat may be a little bit optimistic,” Delco added.
Overall intermodal volumes on the U.S. Class I railroads are flat year-over-year so far in the third quarter, down 6% sequentially.

Delco said J.B. Hunt had 70% of its intermodal customer contracts repriced at the end of the second quarter and that the entire book of business will be repriced by the end of the third quarter. He said the rate increases should be reflected on roughly 85% of its intermodal business this quarter, which will drive revenue per load higher again. The metric was up 15% year-over-year in the second quarter.
But as intermodal pricing steps higher, so have the costs associated with operating a network stressed by overwhelming demand and prolonged delays.
J.B. Hunt has been enforcing assessorial charges more strictly on customers that are turning boxes too slowly. But Delco said there has been little evidence that the fees are working, as some customers are turning containers quicker while others have fallen further behind.
Earlier in the year, the company guided to sequential quarterly margin improvement in the segment as rate increases take hold. J.B. Hunt achieved that goal in the first two quarters of the year. Delco said intermodal margins should continue to improve as revenue per load increases. But cost inflation presents some headwinds as extra miles are being driven by extra drivers to reposition equipment and meet the company’s commitments to customers.
“Congestion is still bad, still hard attracting and retaining drivers,” Delco said. “I could tell you pricing is going to get better, but our costs are also going to get more challenging and how that shakes out will ultimately determine where margins shake out for Q3.”
The market is ripe for intermodal conversion. High fuel prices, extremely tight truck capacity and sky-high truckload rates would typically have shippers fleeing truck markets in favor of rail. But the opposite is occurring as the intermodal complex remains bogged down.
“We’re going to have more containers, we’re still working with customers and we’re still working with the rails to get better fluidity,” Delco said.

Freight Fraud Symposium
Double brokering. AI deepfakes. Identity theft. Freight fraud is an existential threat to the industry. Get ahead of it.
Supply Chain AI Symposium
Past the hype. Join operators, founders, and enterprise leaders figuring out how to deploy AI in supply chain.
Future of Rail Symposium
Reshoring is rewriting freight demand. Join shippers, rail executives, and government officials to shape the next decade.
Double brokering. AI deepfakes. Identity theft. Freight fraud is an existential threat to the industry. Get ahead of it.
Rock & Roll Hall of Fame • Cleveland, OH Register NowPast the hype. Join operators, founders, and enterprise leaders figuring out how to deploy AI in supply chain.
The Old Post Office • Chicago, IL Register NowReshoring is rewriting freight demand. Join shippers, rail executives, and government officials to shape the next decade.
The Signal at Chattanooga Choo Choo • Chattanooga, TN Register Now