


The highlights from Tuesday’s SONAR reports are below. For more information on SONAR — the fastest freight-forecasting platform in the industry — or to request a demo, click here. Also, be sure to check out the latest SONAR update, TRAC — the freshest spot rate data in the industry.
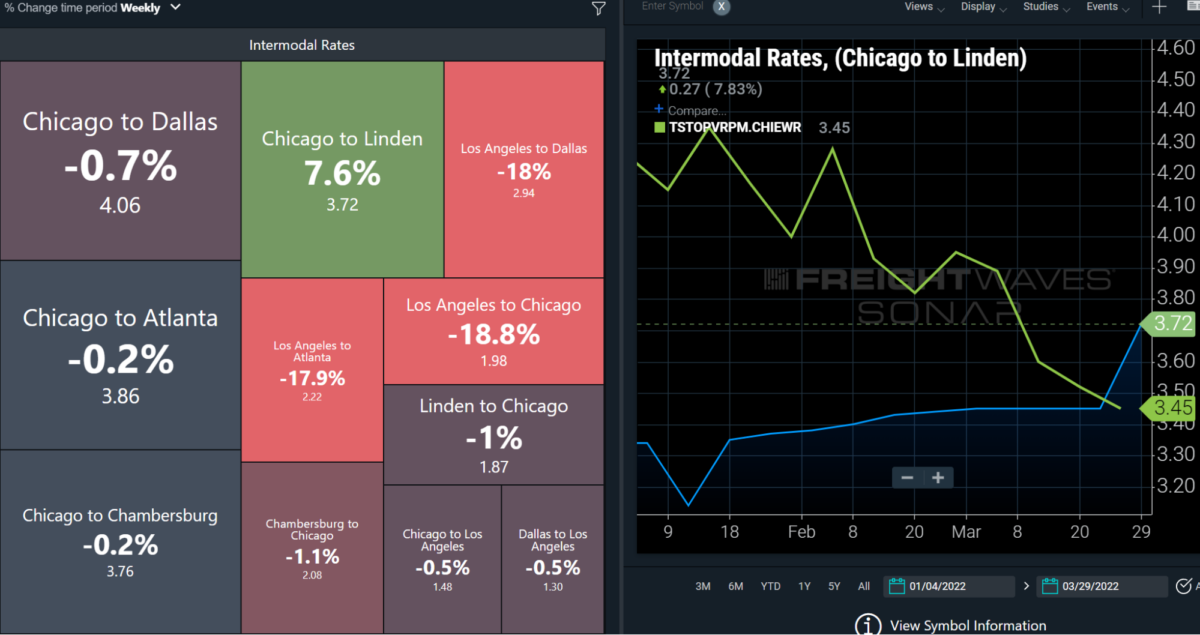
Lane to watch: Chicago to Elizabeth
Overview: Intermodal spot rates have risen as truckload rates have fallen; the Class I railroads are protecting capacity for intermodal shippers with contracts in place.
Highlights:
- Of the 11 densest domestic intermodal lanes, Chicago to Elizabeth was the only one where intermodal spot rates increased in the past week, up 7.6% to $3.72/mile, including fuel surcharges.
- The dry van spot rate in the lane, per the SONAR Market Dashboard app, has fallen 12.4% in the past month to $4.03/mile, including fuel.
- Domestic intermodal volume in this lane has increased from 235 containers/day in mid-March to 272/day in the past week, which explains the increase in domestic intermodal spot rates.
What does this mean for you?
Brokers: Brokers should lower their bids more than they are in most other lanes to reflect tender rejection rates that have fallen faster in this lane than they have in most others. When negotiating with carriers, highlight Elizabeth’s Van Headhaul Index of 50 to show that it remains an attractive destination for carriers.
Carriers: The Elizabeth market is looser than most, so carriers heading there should not expect to find many opportunities to move spot loads. However, Elizabeth remains an attractive destination for dry van carriers since it should be easy for to get reloaded given the current Elizabeth Van Headhaul Index of 50. This highlights that there is far more demand to move dry van loads outbound than demand to move dry van loads inbound.
Shippers: Rising domestic intermodal volume in the lane (at the highest level since February) suggests that the intermodal network is running fairly well. However, the rising domestic intermodal spot rate, which is at odds with other major intermodal lanes, suggests that the Class I railroads have become more concerned with securing containers for shippers with intermodal contracts. Meanwhile, dry van capacity continues to become more available in the lane, which is most important for shippers moving time-sensitive loads.

Outbound tender rejections continued to decline nationwide in the past week (down to 13.38%). These levels have not been observed since around Q2 2020 and are declining relative to falling outbound tender rejection rates nationwide. Additionally a glut of capacity appears to be forming as new entrants into the market have caused capacity to loosen and put downward pressure on rates. The total count of new fleets authorized to hire surged beginning in early 2021 and now sits around 20,166 new authorities in the past month. This indicates a growing trucking supply just as consumer demand is impacted by rising inflation and shifts from goods to services. Based on FreightWaves SONAR data, the shift in consumer demand is having an impact on outbound tender levels, as well as inventory levels (causing fewer replenishment orders). Expect continued downward pressure on spot rates this week as macroeconomic conditions continue to deteriorate for consumer spending, but expect flatbed capacity to remain high, as construction and the related economic and manufacturing activities continue to experience high demand.
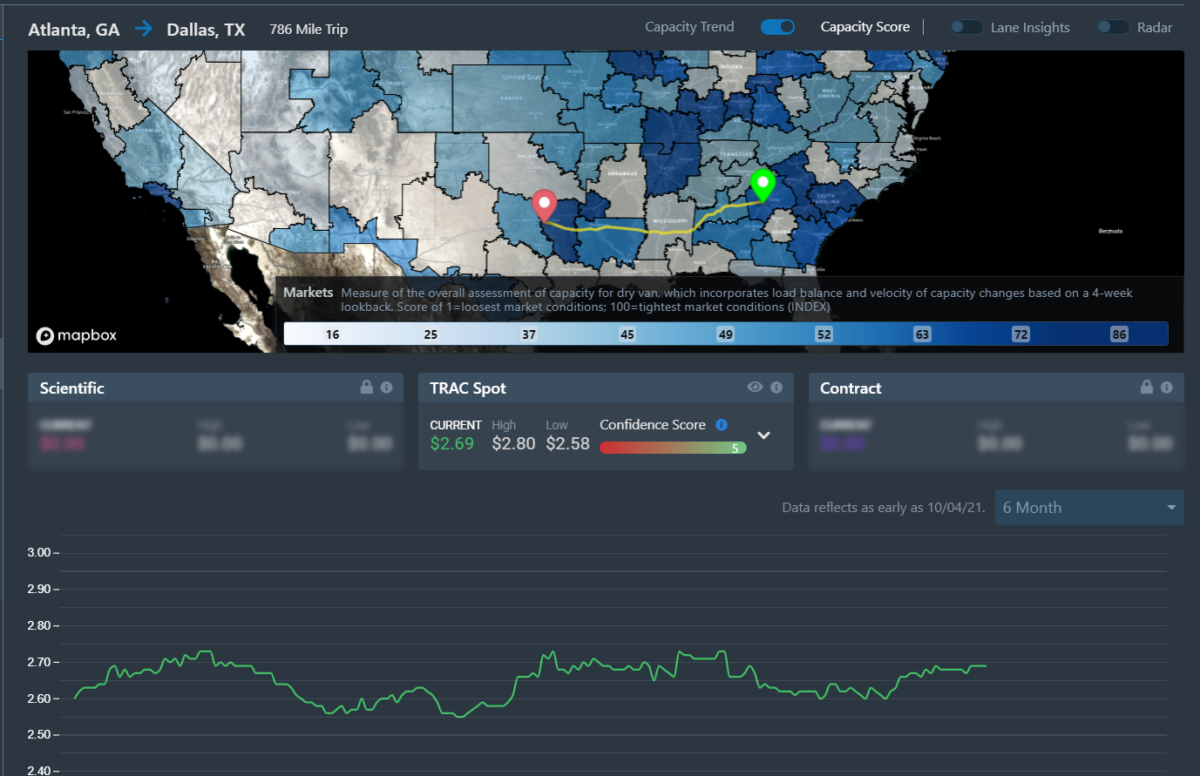
Lane to watch: Atlanta to Dallas
Overview: Spot rates continue to remain sticky out of Atlanta.
Highlights:
- Spot rates are up 9 cents a mile in this lane since March 14, contradicting the 3.5 percentage point drop in lane-specific tender rejection rates.
- Atlanta’s outbound rejection rate has fallen from 13.5% to 10.2% over the past two weeks.
- Dallas is seeing similar conditions to Atlanta, with rejection rates falling rapidly since mid-March.
What does this mean for you?
Brokers: Target a buy rate around $2,100. There may be a bit of a floor around this point thanks to contract rates having risen to similar levels. The market may be easing in general, making the lane easier to cover, but it is not yet at a point of rates falling below contracts.
Carriers: No need to drop below costs or contract rates on this lane at this point. Rates have found a floor and are inching higher, thanks perhaps to increasing fuel prices. Spot volumes should be declining out of Atlanta and Dallas, regardless of the rates.
Shippers: Expect improving compliance in this lane as rejection rates continue to fall. Rates are stable at the moment with carriers covering close to 90% of loads under contract.

As the freight recession for U.S. surface transportation providers deepens, it is only a matter of time before the same recession inevitably reaches ocean container shipping for U.S. imports. The harsh reality is that over the last 12 months, there has been a significant amount of inventory built up here in the U.S. as importers worked to ensure another potential “bullwhip” or “black swan” did not catch them off-guard with too little on hand to keep shelves stocked. Unfortunately, over that same period of time, inflation has taken hold of the U.S. economy, the Russian invasion of Ukraine has increased geopolitical tensions/uncertainty, and ultimately, consumer demand has begun to taper off as consumers are choosing to spend less on goods and more on services as the post-COVID economy shifts spending patterns. This has left the Federal Reserve with few options except to raise the Federal Funds Rate, which should also have a significant impact on liquidity and credit availability for U.S. businesses.
For these reasons, it is expected that the freight recession occurring in the U.S. surface transportation market will bleed over soon enough to ocean container shipping. This should cause spot rates to decrease by 50% to 75% over the next three to four months, but these are still uncharted waters, with little historical data to lean on. The “X-factor” left in this equation is how well ocean container carriers will be able to adequately adjust available capacity on the water to help stabilize ocean container spot rates. Right now, from China to the U.S. we are seeing our capacity index at some of its lowest levels in the past 12 months, so it would seem that they are already working on the decrease in container volumes that we are seeing materialize. Also, booking lead times have decreased dramatically, which is likely to confirm the declining volumes with the lockdowns in Shanghai having very little impact on the data points we track in SONAR thus far.