The highlights from Thursday’s SONAR reports. For more information on SONAR — the fastest freight-forecasting platform in the industry — or to request a demo, click here. Also, be sure to check out the latest SONAR update, TRAC — the freshest spot rate data in the industry.
Lanes to watch
By Zach Strickland, director, Freight Market Intelligence
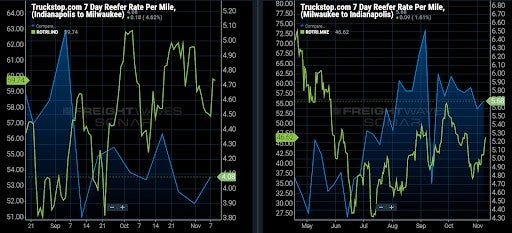
INDIANAPOLIS to MILWAUKEE
Overview: An increase in reefer rejection rates has pushed carrier rates up in both directions of the IND–MKE lane.
Highlights:
- Reefer rejection rates have increased to 59.74% in the Indianapolis market, pushing the average carrier rate to $4.08 all-in rpm.
- Reefer rejection rates have increased to 46.62% in the Milwaukee market, pushing the average carrier rate to $5.68 all-in rpm.
- Indianapolis shippers have increased their reefer tender lead times to 3.87 days, which is still well below the national average of 4.36 days.
What does this mean for you?
Brokers: Capacity is tight on reefer loads that move between the Indianapolis and Milwaukee markets. Brokers should search the spot market for reefer loads that run in both directions of the IND – MKE lane. Increase your bids since rejection rates are trending upward in both markets, and keep downward pressure on your carrier rates. SONAR’s Market Dashboard shows current spot rates for on-demand capacity at $6.15 all-in rpm on the IND–MKE lane.
Carriers: Reefer carriers with excess capacity in the Indianapolis market should search the spot market for loads that deliver into the Milwaukee market. Last week, carriers averaged $4.08 all-in rpm on the lane, and $5.58 all-in rpm on the MKE – IND lane. SONAR’s Market Dashboard shows current spot rates for on-demand capacity at $6.15 all-in rpm on the IND – MKE lane, and $7.70 all-in rpm on the MKE – IND lane. Hold firm on your rates since rejection rates are trending upward in both markets.
Shippers: Indianapolis shippers need to increase reefer tender lead times since rejection rates are climbing in the market. Current tender lead times of 3.87 days are well below the national average of 4.36 days. Secure capacity as early as possible to help avoid the high rates carriers are charging for on-demand capacity. Prepare for market conditions to remain tight through the end of the year.
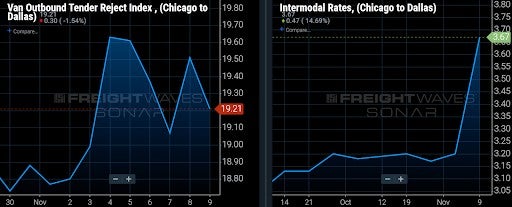
CHICAGO to DALLAS
Overview: Rising tender rejection rates and rising spot rates highlight tightening capacity.
Highlights:
- Door-to-door intermodal spot rates to move 53’ containers increased 15% in the past week – from $3.20/mile to $3.67/mile. Those rates include fuel surcharges.
- In the past two weeks, the Chicago van outbound tender rejection rate increased 98 basis points (bps), while the nationwide van tender rejection rate declined 108 bps.
- FreightWaves TRAC data shows the current average van spot rate in the lane of $3.20/mile, including fuel surcharges, with rates of $3.41/mile and $2.98/mile for rates in the 67th percentile and the 33rd percentile, respectively.
What does this mean for you?
Brokers: Raise your rates in this lane to preserve margins given that the recent trend in van spot rates is rising, according to FreightWaves TRAC. In light of FreightWaves TRAC data, use $3.20/mile as a benchmark for buy rates.
Carriers: Dallas is a Headhaul market with a Van Headhaul Index of 80.8, which means that it should be easy for van carriers to get reloaded in Dallas. Despite it being a Headhaul market, the Dallas van outbound tender rejection rate of 17.56% is 71 bps below the national van tender rejection rate, suggesting there is more available capacity in Dallas than in most markets.
Shippers: It’s clear from comparing van and intermodal spot rates that spot shippers are better off using the highway rather than rail intermodal. Rising spot rates and tender rejection rates in the lane indicate that shippers should extend lead times to at least the 2.5-day average for outbound Chicago van loads.
GREENVILLE (South Carolina) to ALLENTOWN (Pennsylvania)
Overview: Rejections are likely to increase further after the Headhaul Index surge 36% week-over-week.

Highlights:
- Greenville outbound tender volumes are up 6% week-over-week (w/w), signaling that demand for outbound capacity is picking up.
- The Headhaul Index in Greenville is up 36% w/w, but could be poised to increase further as inland import rail container volumes head toward a record high.
- Greenville outbound tender rejections are up 104 bps w/w, signaling that capacity is likely already tightening in the Greenville market.
What does this mean for you?
Brokers: Greenville tender rejections are already up 104 bps w/w, so with outbound volumes increasing 6% w/w and the Headhaul Index increasing 36%, outbound tender rejections are likely to be pushed even higher in the coming days. Make sure your team is aware of the upward pressure on rates, and be sure to prioritize your existing outbound Greenville lanes while this upward pressure continues.
Carriers: If outbound volumes in Greenville continue to increase, and inbound truckload volumes remain relatively flat (or continue dropping), then it is likely that we will see outbound tender rejections continue to increase. Outbound rejections are already up 104 bps w/w, so capacity is likely already tightening. If this current trend continues, the growing imbalance is likely to earn you even more pricing power in the days and weeks ahead.
Shippers: Your shipper cohorts have moderately increased their tender lead times w/w to 2.9 days. This is a signal that they are reacting to a likely tightening in capacity, which is also the same signal being sent by the 104 bps increase in tender rejections w/w. With the volume imbalance growing in Greenville alongside outbound tender rejections, it would be wise to make sure that you push your tender lead times to between 3 and 4 days to ensure you are getting this lane covered without paying above average premiums because of a lack of sufficient lead time.
Watch: Freightonomics
Cleveland market update
By Jim Knuerr, SONAR account executive
The Cleveland market is finally starting to see some relief on contracted freight, and the Outbound Tender Rejection below shows you rejections hitting YTD low numbers of 15%.
Carrier providers are starting to accept Cleveland outbound freight. Brokers that have relied heavily on the spot market in Cleveland may need to change their focus and start trying to lock up this freight for the short or long term.

Listed below are a handful of major lanes out of Cleveland, and the rejection are dropping on each of them month-over-month.

Shippers – Hold your carriers accountable on Outbound Cleveland Freight. It may be good timing to try and recontact some of your highly rejected lanes.
Brokers – If you can still get spot freight out of Cleveland, take it and expect it to move with more ease.
Carriers – Try not to reject Outbound Cleveland freight and if you do need to call your shippers and explain your situation.
Building a quick and easy dashboard
By Michael Vincent, Freightcaster
Are you involved in longhaul, tweener, midhaul, shorthaul, city? What are the percentages? Do you ship reefer or dry or both?
Add questions infinium.
It matters when deciding what the freight market data means.
Volumes taking a bit of a move upward at incredibly high levels. Seasonal type moves at unseasonably high volumes — while capacity seems to be just fine with it.
Those that will be caught off guard, yet again, won’t bother to understand how a hot market with severely strained capacity is recovering without adding new trucks or drivers at any level near what is needed.
Below is a quick and easy dashboard that can be used for any market. I have it set to Ontario, California, or The Inland Empire. A bellwether for understanding the freight markets.
The mix of the length of haul is what I am looking at here. Volumes up and rejections decreasing.
Many reasons for this, and understanding which dynamics are in play is crucial.
One main cause is that the most desired length of haul (and one which just happens to keep capacity within a set region) is growing significantly in respect to the least desired length of haul.

This post originally appeared on Michael Vincent’s LinkedIn account.
Focus on … diesel truck stop actual price per gallon
By Zach Strickland
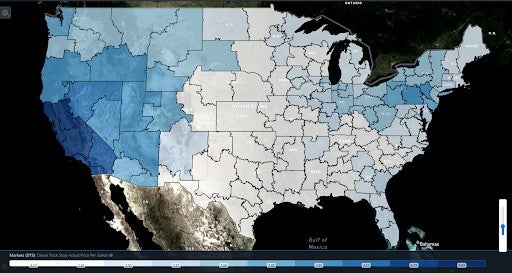
FreightWaves gathers data from hundreds of truck stops to produce a SONAR series that provides daily updates on the average price of diesel at the pump. SONAR has data on individual cities and regions as well as a national average price.
Diesel prices have been rising for several months as the economy recovers from the pandemic shutdowns. Costs will likely continue to rise; perhaps throughout the remainder of the year.
These factors make SONAR’s retail truck stop diesel price index even more important. In the map below, SONAR users can hover over a market to see what the average price per gallon truck stops are charging for diesel.
Carriers will find the lowest prices per gallon for diesel in the Oklahoma City, Austin, Houston, San Antonio, Laredo, Fort Worth, Dallas, Jackson and Tulsa markets, averaging less than $3.35 per gallon.
The San Francisco, Stockton, Fresno, Los Angeles, Ontario, San Diego, Reno, Medford and Harrisburg markets have the highest average price per gallon – over $3.96.
It is very clear in the map below that the further the markets are from the Texas/Oklahoma area, the higher the price that carriers will pay for fuel, with the highest prices in California.