


The highlights from Monday’s SONAR reports. For more information on SONAR — the fastest freight-forecasting platform in the industry — or to request a demo, click here. Also, be sure to check out the latest SONAR update, TRAC — the freshest spot rate data in the industry.
Lanes to watch
By Zach Strickland, director, Freight Market Intelligence
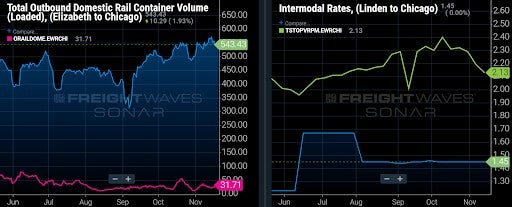
ELIZABETH (New Jersey) to CHICAGO
Overview: Shippers moving less time-sensitive loads should utilize rail intermodal.
Highlights
- In the past two weeks, the van tender rejection rate in the Elizabeth to Chicago lane increased 269 basis points to 19.8%, 30 basis points above the national van tender rejection rate.
- SONAR Market Dashboard shows that brokers are currently paying carriers $2.45/mile, including fuel surcharges, in the lane.
- The door-to-door intermodal spot rate in the lane to move 53’ containers is $1.45/mile, including fuel surcharges.
What does this mean for you?
Brokers: Raise your rates in the lane. While the overall tender rejection rate has increased modestly leading up to Thanksgiving (although, it has risen less before the holiday than it typically does), the tender rejection rate specifically in the Elizabeth to Chicago lane has risen more than most lanes in the past two weeks.
Carriers: Dry van carriers should have an easy time getting reloaded in Chicago given the Chicago Van Headhaul Index of 48, which suggests there is significantly more demand to move outbound van loads than inbound van loads. Meanwhile, the Chicago outbound tender rejection rate of 18.6% is 90 basis points below the national average.
Shippers: Spot shippers moving less time-sensitive loads should look to utilize domestic intermodal given the wide current spread between intermodal and dry van spot rates. With current lead times on similar loads averaging 2.6 days, shippers are unlikely to get loads moved in the lane before Thanksgiving.
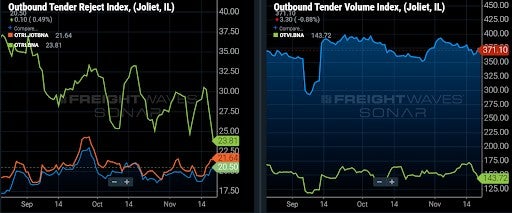
JOLIET (Illinois) to NASHVILLE
Overview: Joliet rejection rates on the rise before the holiday.
Highlights
- Outbound rejection rates have increased nearly two percentage points over the past week from the Joliet market, making it one of the more significant tightening markets in the U.S. when taking volume into account.
- Lane rejection rates to Nashville have moved similarly and at their highest level since late September.
- The Nashville market is easing significantly with rejection rates falling to their lowest point since February.
What does this mean for you?
Brokers: Pad margins without secured capacity. Average spot rates have not increased yet, but there is a wide range of rates according to TRAC which leaves a large margin for error when quoting. Do not take Joliet capacity for granted this week.
Carriers: Divert more capacity to the spot market in this lane. Nashville is easing significantly and will produce less opportunities for both contract and spot freight. Do not accept loads without a solid preplan.
Shippers: Prioritize outbound Joliet freight over most other areas. Expect more upward pressure on spot rates and declining capacity in this lane than many other markets save for Los Angeles.
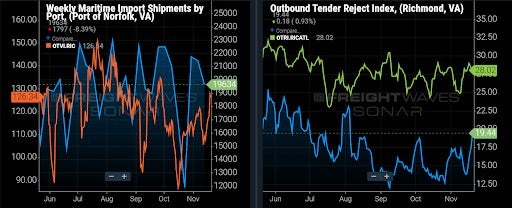
RICHMOND (Virginia) to ATLANTA
Overview: Capacity is likely to get tighter in the days ahead as rejections climb over 5% week-over-week (w/w).
Highlights:
- The Port of Norfolk’s weekly maritime import shipment volumes have been at near record highs for multiple weeks in the past 4 months.
- The Headhaul Index in Richmond is up 16% w/w, but is positioned to climb further in the next week as the rush before “Black Friday” pushes outbound demand higher.
- Outbound tender volumes in Richmond are already up 15% w/w, and are expected to move higher before the Thanksgiving Holidays.
What does this mean for you?
Brokers: The Richmond truckload market is likely to tighten significantly in the days ahead. Already, there has been a 16% w/w in outbound tender volumes, and with record import volumes pouring into the Port of Norfolk for the last 4 months, demand for truckload capacity in Richmond is likely to grow close to (and possibly surpass) record highs as the holidays approach. Make sure you are getting your outbound Richmond loads booked earlier than usual, and be on watch for significant upward pressure on spot rates in the weeks to come.
Carriers: Stay firm on your rates, as you are likely to see pricing power shift further into your favor in the days ahead. A large percentage of import volumes into the Port of Norfolk move inland via drayage carriers into the Richmond market, so with record import volumes moving into the Port of Norfolk over the last few months, outbound truckload volumes in Richmond stand to benefit and the increase in demand will put even more upward pressure on spot rates.
Shippers: Your shipper cohorts currently have tender lead times at 2.6 days, but that is not likely to be sufficient for the increase in demand that is expected in the weeks ahead. In the tightest markets historically, shippers in Richmond have increased lead times to between 3 and 3.5 days to help offset tightening conditions in the outbound truckload market.
Watch: Shipper Update
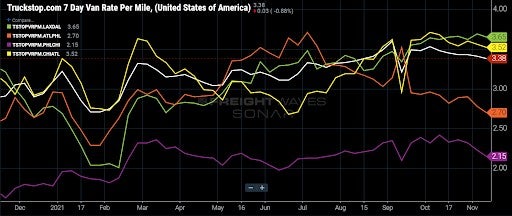
Truckstop.com’s national spot rates
Moving in an opposite direction from tender rejection rates, Truckstop.com’s national spot rate took another step lower last week. The national average spot rate fell by 3 cents per mile, to $3.38, including fuel and other accessorials. Spot rates are still up double digits compared to 2020 levels, now up ~16% y/y.
Of the 102 lanes from Truckstop.com’s load board, 43 reported increases last week. Outbound from Los Angeles took a step higher on six of the eight lanes, with the northbound lane of Los Angeles to Stockton, California, increasing the most, rising 19 cents per mile, to $4.15. The increases out of Southern California are no surprise given capacity has really started to tighten ahead of peak season.
Contract rates also pulled back over the past week, decreasing by 3 cents per mile to $2.65. Dry van contract rates, which are reported on a two-week lag, are just 12 cents per mile off the all-time high set in mid-September.
Contract rates, which are just the base linehaul rate excluding fuel surcharges and other accessorials that are included in spot rates, have significantly closed the gap with spot rates over the past year. Contract rates are outperforming spot rates, continuing to run 17% higher than in 2020.
Watch: Carrier Update
Outbound tender market shares
By Zach Strickland
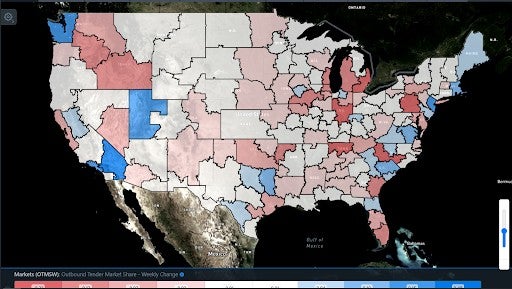
Outbound tender market share measures the percent of total outbound tender volumes represented in each of the 135 markets in the United States.
The Ontario and Salt Lake City markets are showing some of the most significant increases (blue) in outbound market share values over the past week, indicating that demand may be on the rise and capacity will be at increasing risk.
Many of the markets in the eastern half of the country are showing strong declining (red) signals outside of the eastern seaboard.
Many of the markets are in close proximity to where drivers are domiciled and are currently being positioned to come off the road, pushing rejection rates lower in these markets.
Use the weekly change in outbound market share map to quickly identify areas where demand side conditions are changing significantly.
Focus on … trucking capacity
By Zach Strickland
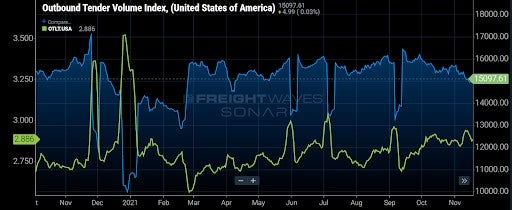
It is a foregone conclusion that truckload capacity is expected to tighten significantly over the next week. Interestingly, demand appears to have declined over the past week, which may be a sign that many shippers have planned for the upcoming weeks being some of the more difficult to navigate.
Lead times have been unseasonably on the rise for the last few months, indicating shippers are more aware of the challenges of securing capacity than ever.
Regardless, national rejection rates are back on the rise after about a two-month decline – even as tender volumes ease.
Drivers will be coming off the road and will be increasingly positioned closer to their domiciled locations over the next two weeks, which will pull them out of some of the heaviest outbound locations. This is already apparent in southern California where rejection rates have already hit multi-month highs.
Capacity has also tightened in areas like the Pacific Northwest where harvests and Christmas tree moves have pushed spot rates to historical highs.
Focus on … intermodal/rail
By Mike Baudendistel
I recommend checking out FreightWaves’ writeup of the annual RailTrends conference, which took place last week in New York. The quotes from that FreightWaves article that stand out to me are those from Larry Gross, president and founder of Gross Transportation Consulting.
He said that the share of freight movement held by intermodal in the third quarter was the lowest in almost 12 years – and that intermodal has given back all of its market share gains since 2009.
While those are discouraging comments from a true intermodal expert, I found comments from both Schneider National and Hub Group on their most recent analyst calls to have been somewhat encouraging – both domestic intermodal providers noted that railway fluidity has improved in recent weeks.
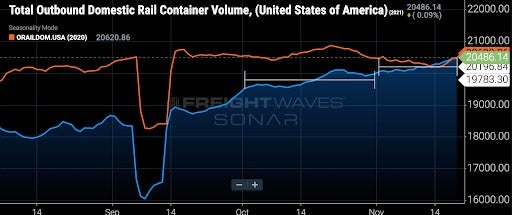
To help monitor intermodal network fluidity going forward, I recommend using the daily, and very granular, intermodal volume data contained in SONAR.
In contrast to typical seasonality (October is typically the peak intermodal volume month), daily domestic intermodal volume increased 2% in November from October and is now running roughly in line with year-ago levels.
I believe that increase reflects improvements in railway fluidity and more transloading of imported goods from international containers to domestic containers on the West Coast.