
We’re regularly enhancing and improving SONAR to meet the needs of the ever-changing freight market and the needs of our customers. To help keep SONAR users informed, we deliver a brief recap of newly released data sets, market indices, and product feature improvements in our This Week in SONAR series.
On a market level, not all rejection rates are created equally. For example: a 10% or 1000 basis point OTRI increase in the Bismarck, North Dakota market is not as significant as a 1% or 100 basis point change in the Atlanta market.
In this example, Atlanta represents a much larger portion of the national load volume than Bismarck, meaning fewer loads need to be rejected to create large changes in rejection rates in the smaller market. Identifying the most relevant markets by rejection rate change on a heat map or watchlist can be cumbersome because smaller markets have higher levels of volatility, therefore, exaggerating the scale. Combining volume with rejection rates into one number makes it easier to identify the most significant capacity shifts in the U.S.
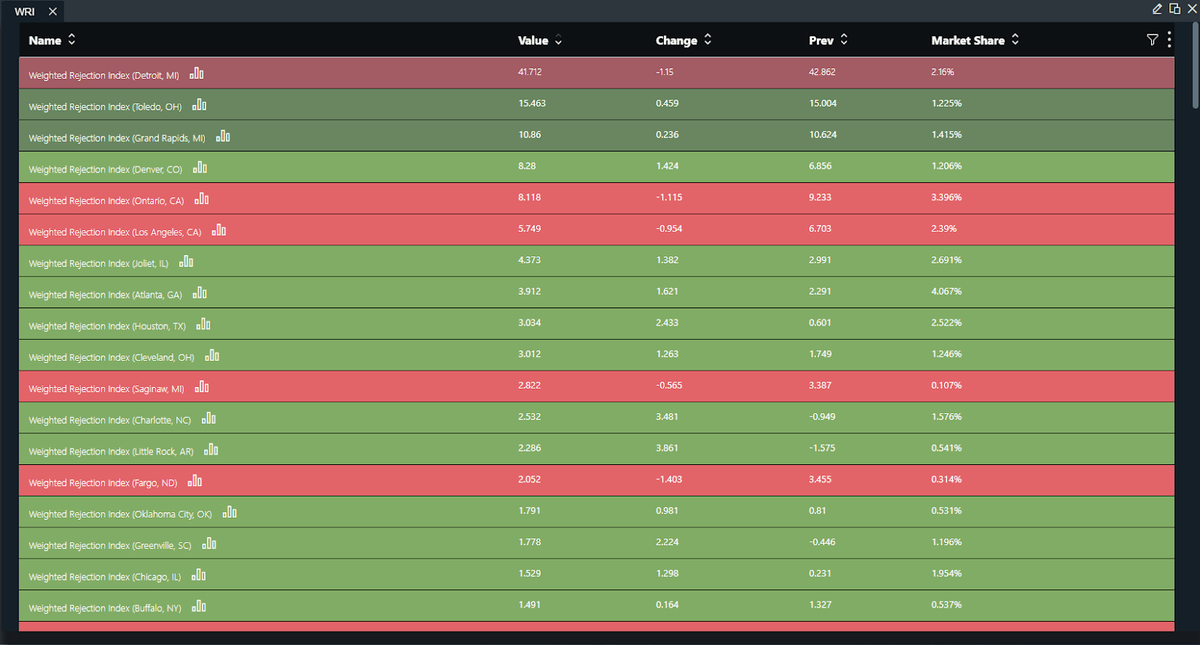
The weighted rejection index (WRI) combines market share and weekly change in outbound rejection rates. This value combines market size with rejection rate changes, which enables the user to see which markets are most relevant from a capacity change standpoint.
The formula is: Outbound Tender Market Share (OTMS) x Outbound Tender Rejection Index Weekly Change (OTRIW)=Weighted Rejection Index (WRI).
For example: Atlanta tender rejection rates moved from 5% to 6% over the last 7 days while currently accounting for 4% of the U.S. outbound load volumes. The calculation would be: 4% x 1% = 4 WRI.
By contrast, the smaller Bismarck market moves from a 6% to a 16% OTRI over the course of a week and accounts for .01% of the total U.S. outbound load volume. The WRI would be: 10% x .01% = 0.1 WRI. The WRI makes it easier to see significant capacity changes on maps and watchlists while simultaneously signifying the impact of each market on national capacity over time in a chart.
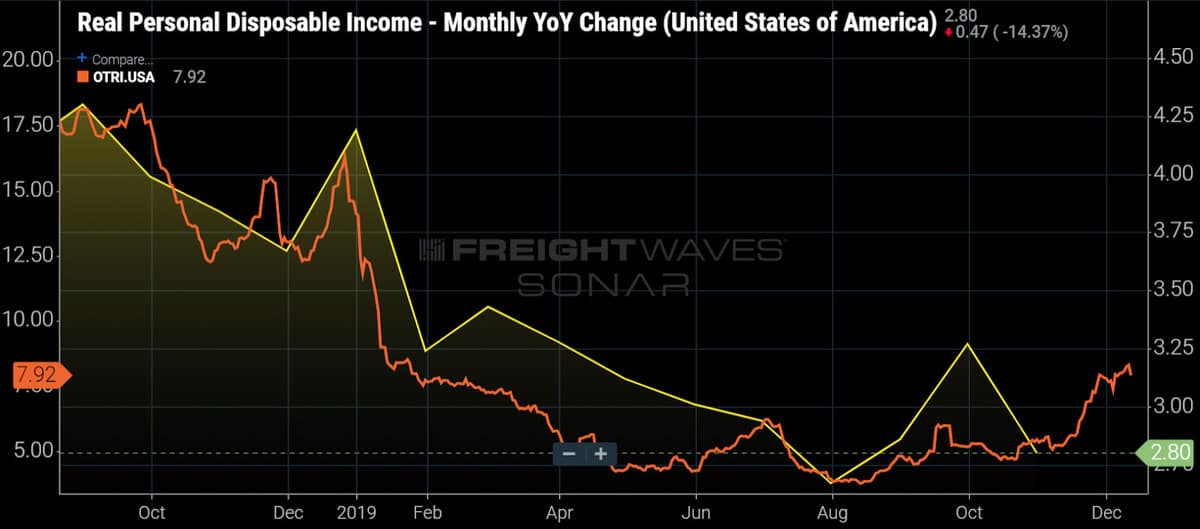
The consumer is the backbone of the U.S. economy, especially while other segments slow in their pace of growth. The status of those consumers plays a pivotal role in their ability to prop up the overall U.S. Economy. The amount of disposable income of consumers impacts their ability to facilitate these purchases.
The real personal disposable income data was previously available in SONAR, distributed on a quarterly cadence. The new release will have real personal disposable income broken out on a monthly basis, as well as year-over-year for rate of change comparisons.
Real disposable income is a post-tax adjustment that shows the changes in income for households. The higher this is, the more they can spend on goods and services. The goods component, in particular, has implications for freight movements throughout the country. The more goods are purchased, the tighter capacity is, placing upward pressure on rejection rates.
All previous SONAR release notes are available HERE. Learn more by using Sue Says in SONAR and clicking on the orca! If you have any questions, please reach out to your Customer Success rep or email sonarsupport@www.freightwaves.com.
SONAR is the fastest and most comprehensive freight market data and analytics platform in the world. These are just a few of the hundreds of unique data sets available to SONAR subscribers. Not a SONAR user yet? Sign up for a free test drive here.
Brokerage Compliance Symposium
The day before F3. Every compliance issue you face - fraud exposure, carrier liability, FMCSA rules, cargo theft, insurance gaps - navigated by attorneys and operators defining best practices in a changing industry.
F3 Awards Dinner
The night before F3. FreightTech100 companies honored. FreightTech 25 and Shipper of Choice winners revealed live. Cocktail reception into dinner and live music - 300 industry leaders in one purpose-built room.
F3: Future of Freight Festival
Industry-defining keynotes, rapid-fire technology demos, and industry leaders networking in experiences across Chattanooga - plus the inaugural F3 Awards Dinner featuring the FreightTech and Shipper of Choice reveals.
The day before F3. Every compliance issue you face - fraud exposure, carrier liability, FMCSA rules, cargo theft, insurance gaps - navigated by attorneys and operators defining best practices in a changing industry.
The Signal at Chattanooga Choo Choo • Chattanooga, TN Register NowThe night before F3. FreightTech100 companies honored. FreightTech 25 and Shipper of Choice winners revealed live. Cocktail reception into dinner and live music - 300 industry leaders in one purpose-built room.
The Signal at Chattanooga Choo Choo • Chattanooga, TN Register NowIndustry-defining keynotes, rapid-fire technology demos, and industry leaders networking in experiences across Chattanooga - plus the inaugural F3 Awards Dinner featuring the FreightTech and Shipper of Choice reveals.
The Signal at Chattanooga Choo Choo • Chattanooga, TN Register Now