FREIGHTWAVES’ SONAR CHART OF THE WEEK (Mar 11 – Mar 17, 2019)
Chart of the Week: Headhaul Index – Los Angeles, Stockton (SONAR:HAUL.LAX, HAUL.SCK)
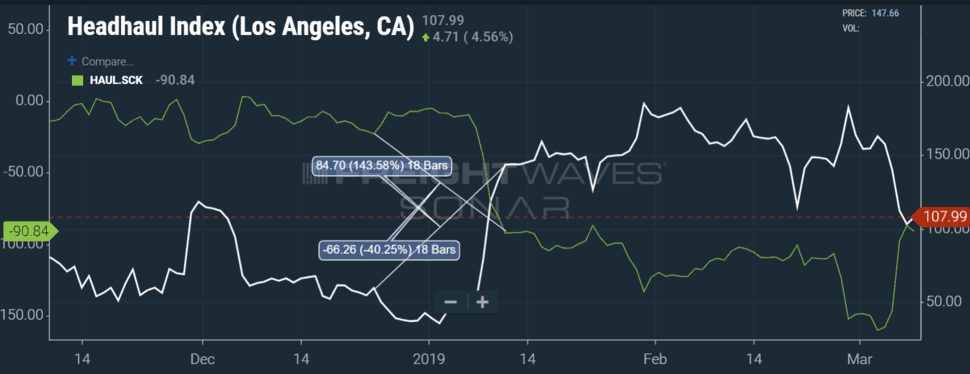
L.A. and Stockton freight flows have developed a strong negative correlation in the past six months. (SONAR: HAUL.LAX, HAUL.SCK)The relationship between the northern and southern California freight markets is reasonably well understood among carriers and brokers who operate in the region on a regular basis. There is a lot more freight going into the northern California markets from L.A than coming out. The recent influx of international containers has grossly exacerbated this relationship as companies pull excess inventory into the country to ensure they will not be hit by increased tariffs. The two markets’ Headhaul Index (HAUL) values have been moving in opposing directions over the past six months – increasingly negatively correlated or divergent.
When two measures are correlated, that means that the two numbers move in sync with each other, indicating a relationship exists between the two values. When they are positively correlated it means the values move at similar times in the same direction—as one value increases so does the other. When the values have a negative correlation, it means they move in opposite directions—one increases and the other decreases.

Correlation is measured on a scale of 1 to -1. The measurement is called the correlation coefficient. The closer the correlation coefficient is to 1, the closer the values move in the same direction. The closer the value is to -1, the more the values move in opposition. In June and July the HAUL values had a loose positive correlation, hovering around a 0.5. In January into early February the 28-day correlation was -0.99, an almost perfect negative correlation.
The Headhaul Index measures the difference between outbound and inbound load volumes. If a market has a positive HAUL value, there are more outbound loads than inbound, where a negative value indicates there are more inbound than outbound loads. L.A.’s HAUL value jumped coming out of the New Year, increasing 143% over pre-Christmas levels. Conversely, Stockton’s HAUL value dropped 43% in the same time frame. So why does this matter?
Carrier rates are heavily influenced by the availability of loads in an area. Markets with positive HAUL values tend to have better odds for carriers to find loads moving out of the market. These markets will have lower empty or deadhead mile percentages.
The fact the L.A. market has plenty of freight available means there will be downward pressure on inbound L.A. rates in the spot market. If that trend lasts long enough it will end up impacting contract rates. On the other end of the spectrum, loads going into the Stockton market will see upward rate pressure, since it will be more difficult for carriers to find backhauls due to the oversupply of trucks in the market.
The fact these two markets appear to be working in an almost perfect opposition, considering their proximity to each other, is a good indication that a lot of outbound L.A. freight has its destination in the Stockton market. Carriers accepting loads into the L.A. market are probably only thinking one load in advance. The problem with accepting loads into the L.A. market currently, is that most of the freight is ending in backhaul markets like Stockton and Phoenix.
Carriers should be thinking about the odds of finding loads many markets in advance. If market dynamics change, which they appear to be doing, carriers will be in a poor position to take advantage. The knowledge that the trip to the West Coast will eventually hit a dead end should put upward pressure on rates even though the L.A. outbound situation is still quite strong. Deadheading out of northern California or Phoenix is an inevitability that should be factored into any current rates.
About the indices presented in this article
(SONAR: HAUL.LAX, HAUL.SCK) Headhaul Index – Los Angeles, Stockton – The Headhaul Index is the absolute value of the outbound tender volume index less the inbound tender volume index for individual markets. The higher the value the more the amount of outbound loads exceeds inbound loads and vice versa. A very negative value indicates the market is a heavy backhaul market.
About Chart of the Week
The FreightWaves Chart of the Week is a chart selection from SONAR that provides an interesting data point to describe the state of the freight markets. A chart is chosen from thousands of potential charts on SONAR to help participants visualize the freight market in real-time. Each week the Sultan of SONAR will post a chart, along with commentary live on the front-page. After that, the Chart of the Week will be archived on FreightWaves.com for future reference.
SONAR aggregates data from hundreds of sources, presenting the data in charts and maps and providing commentary on what freight market experts want to know about the industry- in real time.
The FreightWaves data-science and product teams are releasing new data-sets each week and enhancing the client experience.
To find out more about SONAR go here or to setup a demo click here.
Brokerage Compliance Symposium
The day before F3. Every compliance issue you face - fraud exposure, carrier liability, FMCSA rules, cargo theft, insurance gaps - navigated by attorneys and operators defining best practices in a changing industry.
F3 Awards Dinner
The night before F3. FreightTech100 companies honored. FreightTech 25 and Shipper of Choice winners revealed live. Cocktail reception into dinner and live music - 300 industry leaders in one purpose-built room.
F3: Future of Freight Festival
Industry-defining keynotes, rapid-fire technology demos, and industry leaders networking in experiences across Chattanooga - plus the inaugural F3 Awards Dinner featuring the FreightTech and Shipper of Choice reveals.
The day before F3. Every compliance issue you face - fraud exposure, carrier liability, FMCSA rules, cargo theft, insurance gaps - navigated by attorneys and operators defining best practices in a changing industry.
The Signal at Chattanooga Choo Choo • Chattanooga, TN Register NowThe night before F3. FreightTech100 companies honored. FreightTech 25 and Shipper of Choice winners revealed live. Cocktail reception into dinner and live music - 300 industry leaders in one purpose-built room.
The Signal at Chattanooga Choo Choo • Chattanooga, TN Register NowIndustry-defining keynotes, rapid-fire technology demos, and industry leaders networking in experiences across Chattanooga - plus the inaugural F3 Awards Dinner featuring the FreightTech and Shipper of Choice reveals.
The Signal at Chattanooga Choo Choo • Chattanooga, TN Register Now