Chart of the Week: Accepted Truckload Volume Index, SONAR Truckload Rejection Index – USA SONAR: ASTVI.USA, STRI.USA
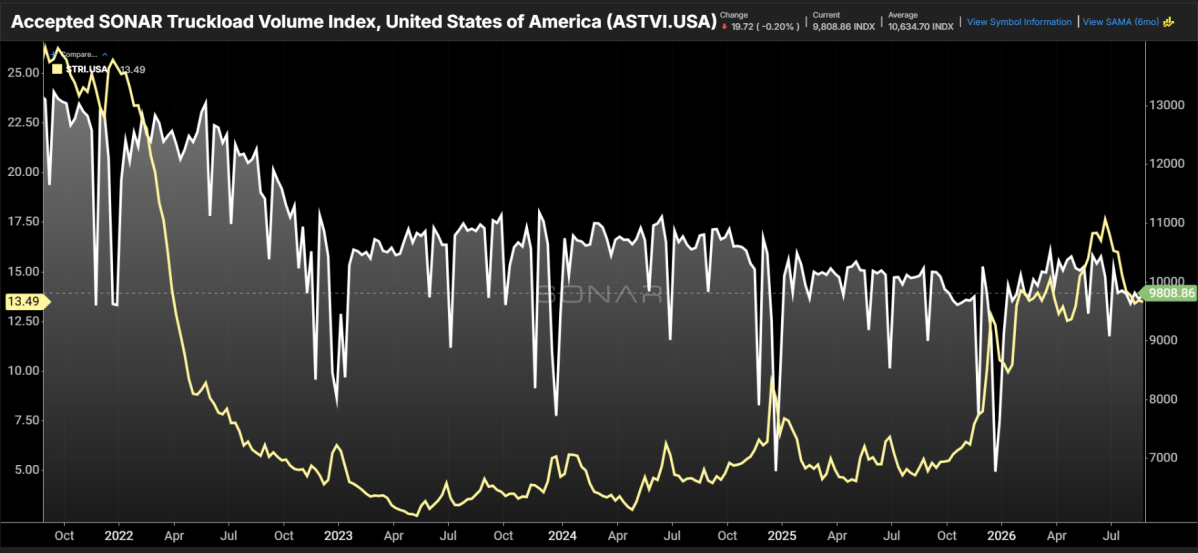
The Accepted SONAR Truckload Volume Index (ASTVI), which measures the volume of truckload tenders carriers accept for loads moved under existing rate agreements, averaged around 9,800 last week. The SONAR Truckload Rejection Index (STRI), which measures the percentage of tendered loads rejected, hovered around 13.5%. While both are down from their 12-month highs, together they suggest the current truckload market cycle is more supply-driven than any in recent history — and still has room to run.
Accepted tender volumes are a fairly good proxy for total truckload demand when rejection rates are relatively low (spot market or outside existing contracts.
Accepted volumes and tender rejection signals
When the trucking market tightens and rejection rates increase, accepted volumes become a useful anchor for how much freight carriers are able to cover with existing capacity. When ASTVI rises and STRI declines, that’s a sign of capacity growth or an improvement in market efficiency. A good signal of capacity erosion is when accepted tenders are flat and rejections rise, as was the case in October of both 2024 and 2025. When the two fall together, that’s more reflective of pure demand deterioration — as was the case this past July.
The recent drop in demand pulled rejection rates lower, but that wasn’t a sign that capacity had grown. Shippers have been using intermodal more frequently because of its cost savings relative to trucking. Demand-side conditions tend to be more volatile and move the market faster. Supply-side shifts are much slower — which is why it took more than three years for the market to correct the dramatic oversupply that followed COVID.
Recent ASTVI levels are actually close to where they were in 2019 — lower than most of the past four years, with the exception of last October and November. Rejection rates were below 5% for most of 2019 and below 6% last fall — roughly the same demand, but with more than twice the tightness.
Supply’s slow crawl
While demand deterioration is still possible, the data suggests there’s more room for it to grow than to contract. Recent Q2 2026 earnings reports show no evidence of fleet growth — most carriers reported annual declines in active units.
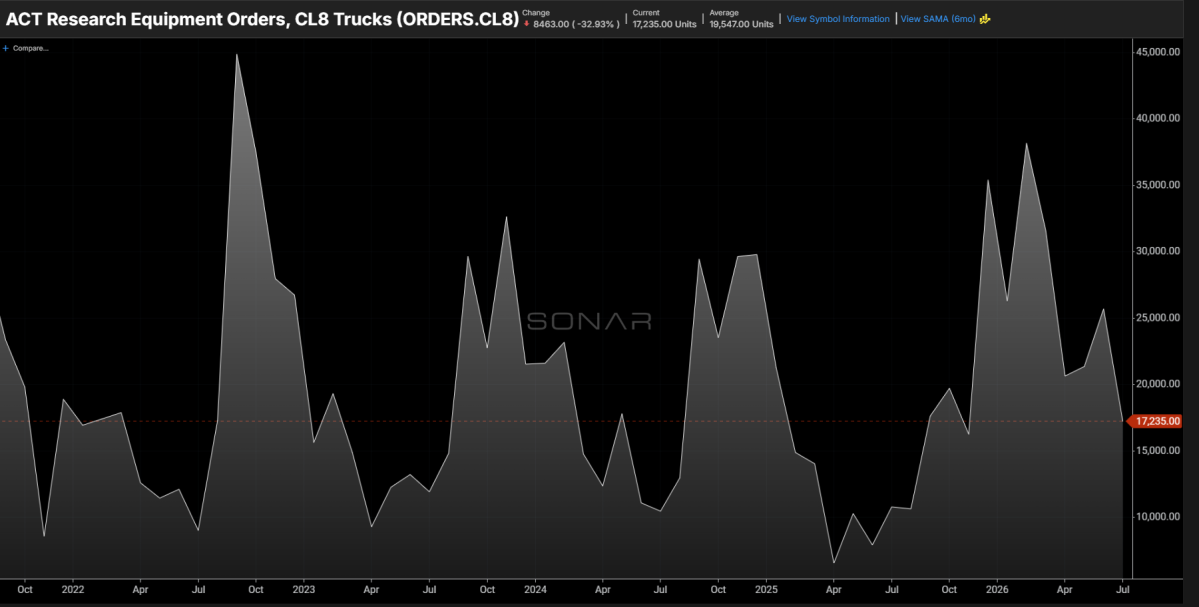
Class 8 orders are up this year, but that’s off an abysmal 2025 comp, and both ACT and FTR cite fleet replacement, not growth, as the primary driver.
It may still be early to see strong movement, but carriers are coming off one of the longest and most challenging freight markets since the Great Recession in 2009. Cash reserves are low and debt is high. This cycle still has a ways to go if the goods economy holds up. Risks skew toward further tightening rather than rapid softening — demand growth, rail disruptions, intermodal rate increases, and continued government pressure on capacity all point the same way.
About the Chart of the Week
The FreightWaves Chart of the Week is a chart selection from SONAR that provides an interesting data point to describe the state of the freight markets. A chart is chosen from thousands of potential charts on SONAR to help participants visualize the freight market in real time. Each week a Market Expert will post a chart, along with commentary, live on the front page. After that, the Chart of the Week will be archived on FreightWaves.com for future reference.
SONAR aggregates data from hundreds of sources, presenting the data in charts and maps and providing commentary on what freight market experts want to know about the industry in real time.
The FreightWaves data science and product teams are releasing new datasets each week and enhancing the client experience.
To request a SONAR demo, click here.
Brokerage Compliance Symposium
The day before F3. Every compliance issue you face - fraud exposure, carrier liability, FMCSA rules, cargo theft, insurance gaps - navigated by attorneys and operators defining best practices in a changing industry.
F3 Awards Dinner
The night before F3. FreightTech100 companies honored. FreightTech 25 and Shipper of Choice winners revealed live. Cocktail reception into dinner and live music - 300 industry leaders in one purpose-built room.
F3: Future of Freight Festival
Industry-defining keynotes, rapid-fire technology demos, and industry leaders networking in experiences across Chattanooga - plus the inaugural F3 Awards Dinner featuring the FreightTech and Shipper of Choice reveals.
The day before F3. Every compliance issue you face - fraud exposure, carrier liability, FMCSA rules, cargo theft, insurance gaps - navigated by attorneys and operators defining best practices in a changing industry.
The Signal at Chattanooga Choo Choo • Chattanooga, TN Register NowThe night before F3. FreightTech100 companies honored. FreightTech 25 and Shipper of Choice winners revealed live. Cocktail reception into dinner and live music - 300 industry leaders in one purpose-built room.
The Signal at Chattanooga Choo Choo • Chattanooga, TN Register NowIndustry-defining keynotes, rapid-fire technology demos, and industry leaders networking in experiences across Chattanooga - plus the inaugural F3 Awards Dinner featuring the FreightTech and Shipper of Choice reveals.
The Signal at Chattanooga Choo Choo • Chattanooga, TN Register Now