




Truckload broker Landstar System noted strong demand for its dry van and flatbed offerings on its third-quarter call with analysts on Tuesday. A tightened capacity backdrop and the buildout of data centers are shaping the favorable fundamentals. However, insurance claims activity clouded an otherwise solid result.
“You can look down the P&L and if you skip one line known as insurance and claims, you’d have a lot of good news to write home about,” said Landstar President and CEO Frank Lonegro.
Landstar (NASDAQ: LSTR) reported third-quarter earnings per share of $1.42, which was 24 cents below the consensus estimate. The miss was attributable to $13 million (29 cents per share) in adverse adjustments to claims reserves and $8 million (18 cents per share) in unfavorable developments on two prior-year claims.
The result was 20 cents better than the adjusted EPS result from a year ago, which excluded several non-recurring items.
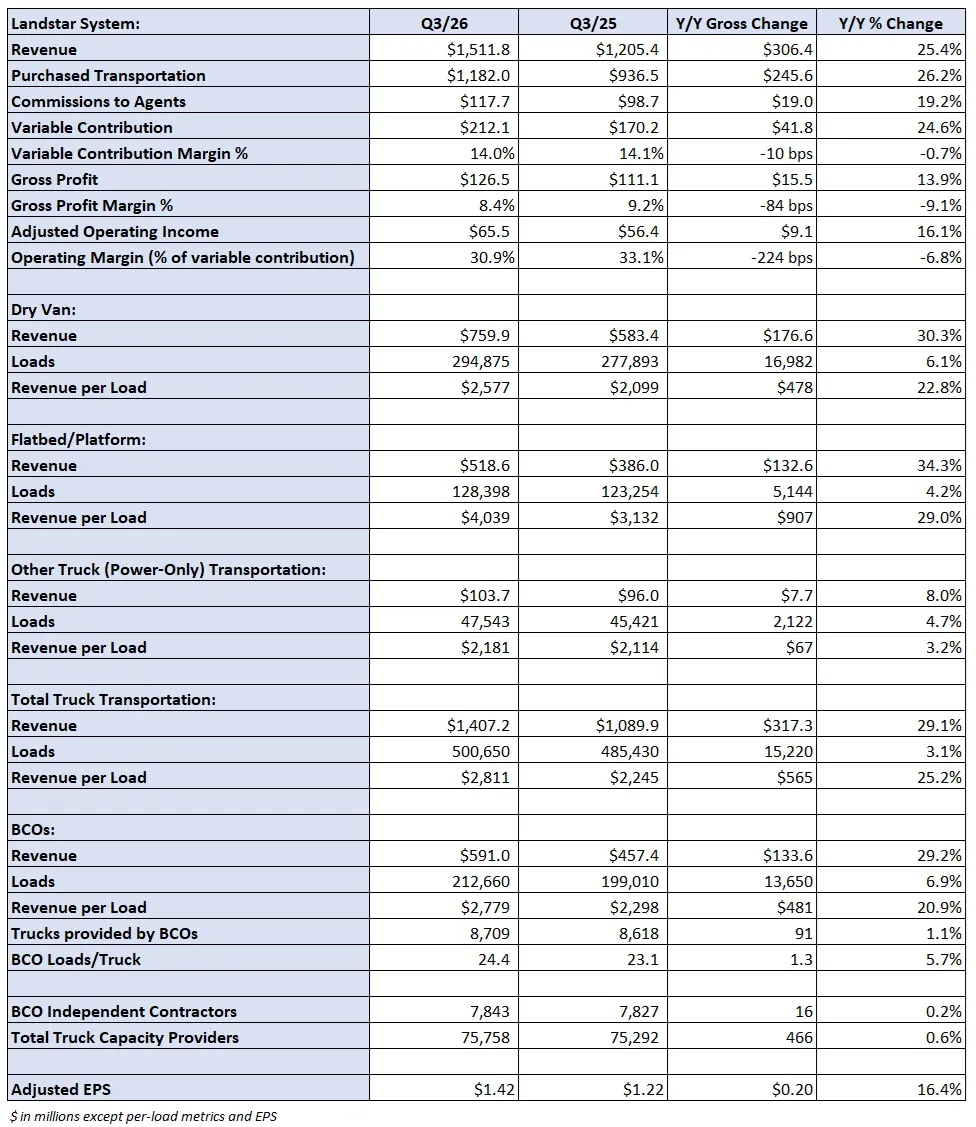
Consolidated revenue was up 25% y/y to $1.51 billion, which was largely in line with the consensus estimate.
Total truck revenue increased 29% y/y to $1.41 billion as loads increased 3% and revenue per load jumped 25%. Higher diesel fuel prices, along with improving TL pricing, drove the yield increase. Revenue per load was up 7.5% from the second quarter.
Dry van loads increased 6% y/y, with revenue per load up 23%. Flatbed loads increased 4% y/y, with yield up 29%. Landstar noted elevated heavy-haul demand.
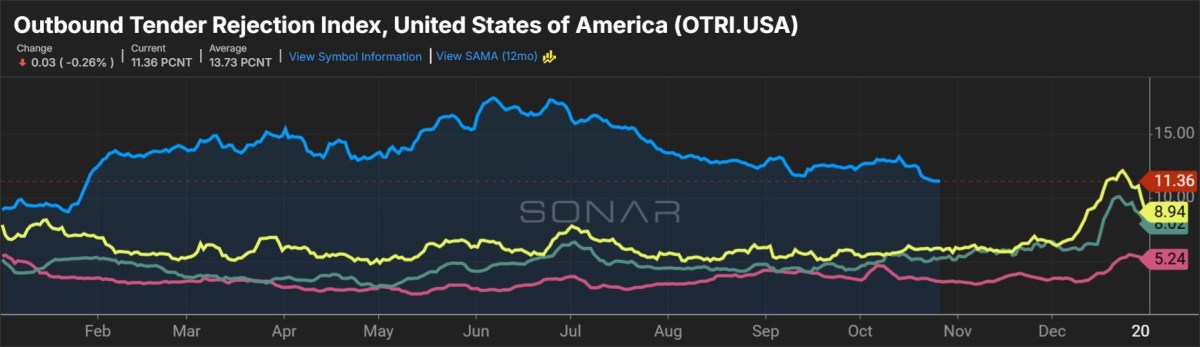
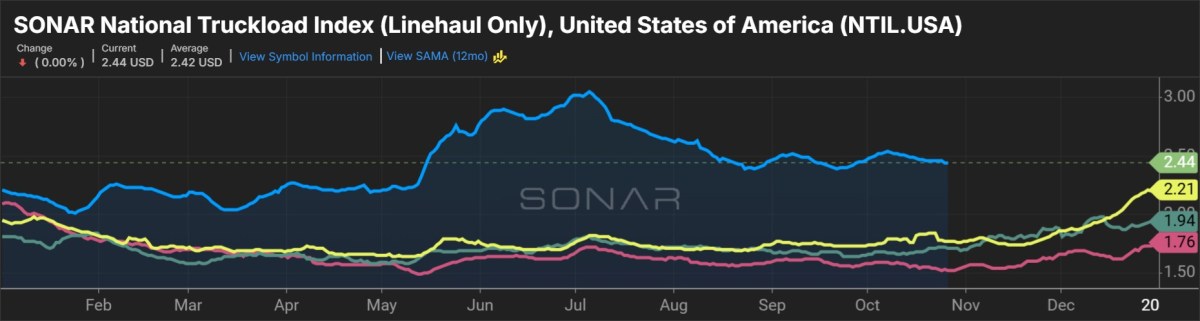
Total truck loads are up 7% y/y in October, with revenue per load 29% higher. Both metrics are running “slightly above” historical sequential trends. The company normally sees a slight increase in truck revenue from the third to the fourth quarter as both loads and revenue per load increase approximately 1%.
Landstar culled its approved carrier list from over 100,000 in 2022 to nearly 68,000 in the recent quarter. The bulk of the reductions occurred in 2023 and into 2024 to combat cargo theft. The decline was also the result of deteriorating TL market conditions, especially for owner operators. Landstar’s approved carrier list was up 5% sequentially in the third quarter.
Trucks provided by business capacity owners (BCOs) increased 165 units sequentially to 8,709. This was the largest sequential increase since the 2021 third quarter. The BCO truck count is up 22 units from the end of the third quarter. The BCO truck turnover rate improved 480 basis points y/y to 26.6%.
BCO revenue per mile—Landstar’s preferred metric for TL pricing as it excludes fuel surcharges—was up 23% y/y on dry van loads and up 19% y/y on flatbed shipments. BCO revenue per load was 10.9% higher sequentially in the period.
Landstar’s BCOs are owner-operators who haul almost exclusively for the company. Changes among this segment of capacity have historically signaled turns in the broader TL market.
Variable contribution, or net revenue, increased 25% y/y to $212 million. (The calculation measures revenue remaining after purchased transportation expenses and agent commissions are paid.) A variable contribution margin of 14% was 10 bps lower y/y.
The adjusted operating margin (as a percentage of variable contribution) declined 220 bps y/y to 30.9%.
Insurance and claims expenses (as a percentage of BCO revenue) increased 220 bps y/y to 9.4%. The expense line was up $22.3 million y/y (to $55.3 million) due to the aforementioned unfavorable claims items, totaling $21 million. However, Landstar’s accident frequency improved again, dropping to 0.57 DOT reportable accidents per million miles through the first nine months of the year.
A spike in nuclear verdicts has materially moved the expense line in recent years. In 2016, the company guided insurance expense to just 3.2% of BCO revenue.
Why it matters? Landstar’s commentary provides some insight on how the industry is adapting, following the Supreme Court’s broker liability ruling. Its third-quarter results highlight how claims volatility can offset improving freight fundamentals, especially as insurers and brokers continue to adjust to a tougher liability environment.
F3: Future of Freight Festival
Industry-defining keynotes, rapid-fire technology demos, and industry leaders networking in experiences across Chattanooga - plus the inaugural F3 Awards Dinner featuring the FreightTech and Shipper of Choice reveals.
Industry-defining keynotes, rapid-fire technology demos, and industry leaders networking in experiences across Chattanooga - plus the inaugural F3 Awards Dinner featuring the FreightTech and Shipper of Choice reveals.
The Signal at Chattanooga Choo Choo • Chattanooga, TN Register Now