FreightWaves expert breaks down 20 years of freight market cycles, from the muted early 2000s to the current volatile environment. Discover how economic variables and policy changes have shaped boom and bust periods, leading to today’s complex supply chain challenges. Learn why assuming a quick end to the current cycle could be a critical mistake for industry pros.
The current freight cycle is nowhere near its conclusion, and anyone positioning for a quick market reversal is making a serious miscalculation. That is the central warning from Zach Strickland in a recent SONAR update, where he walked through more than two decades of freight data to argue that most cycles run far longer than market participants expect — and that this one is only in its early stages.
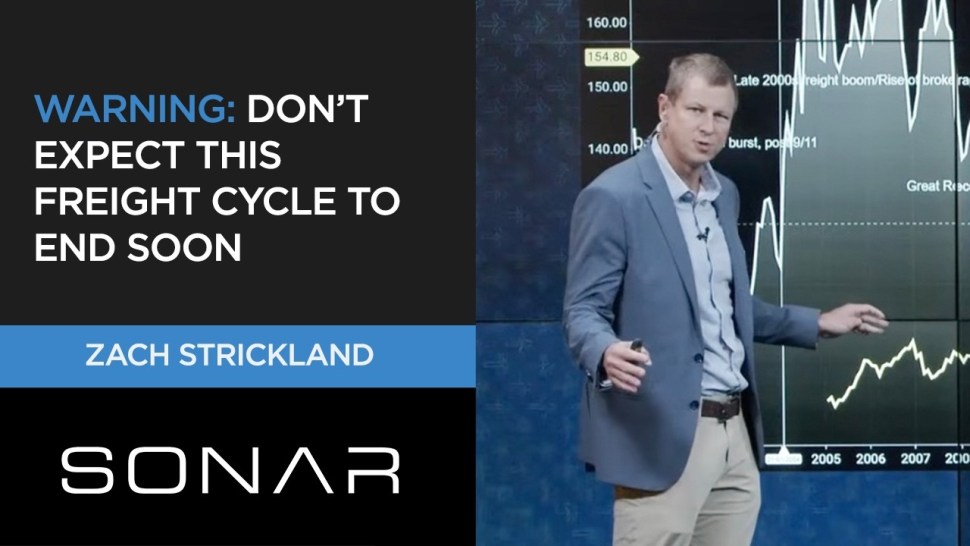
Strickland anchored his analysis to the Cass Freight Shipments Index, a measure of freight shipment volumes, paired with the Cass Truckload Linehaul Index, which tracks base truckload costs excluding fuel. Charting the data from 2000 onward, he identified at least six distinct disruptions since 2016 alone, calling the current stretch “one of the weirdest and most prolonged weirdest sections of the freight history that we’ve ever had.”
He traced the roots of today’s market structure to the 2004–2008 era, when diesel price volatility accelerated the rise of the fuel surcharge, hurricanes disrupted supply chains, and the brokerage industry began taking its modern shape. That period was followed by the steep freight recession of 2008–2009 — “arguably one of the hardest periods of freight history in the modern era” — and then a stretch of relative calm from 2010 to 2016 that Strickland called “the great stability,” marked by predictable seasonal volume rhythms and steady rate increases each cycle.
“If you were expecting this cycle to be over in December, that would probably be the worst decision you could make because we are very early and most of these cycles last much longer than that period of time,” said Strickland.
On the current market, Strickland noted that the Outbound Tender Rejection Rate had slipped to 12.73% at the end of October, but cautioned against reading too much into the dip. Tender volumes were rising even as rejection rates fell — a conflicting signal — and the Thanksgiving seasonal surge had yet to show up in the data. “The market’s not falling apart from a demand side perspective,” he said, adding that the rejection rate slide should not be assumed to have any staying power.
Geographically, rate volatility was concentrated in the West. Van rates were most active across the Mountain Prairie region, with El Paso, Tucson, and Ontario seeing notable swings. Refrigerated rates showed elevated blue — indicating falling rates — along the West Coast, while the Weighted Rejection Index flagged dark-blue rejections centered on Ontario and Southern California. Strickland specifically highlighted the Southern California situation as a forward-looking concern tied to an ongoing port strike, warning shippers to keep a close watch on the Los Angeles market.
The broader takeaway from Strickland’s historical review is structural: rapid freight booms create the conditions for equally sharp busts, which is why economists target 2% to 3% GDP growth as a stabilizing benchmark. For carriers, brokers, and shippers, the implication is that volatile, extended cycles — not the smooth 2010–2016 pattern many treat as normal — may be the more reliable baseline for planning.
- Tender rejection rates stand at 12.73% with volumes rising simultaneously, sending conflicting signals about near-term market direction.
- Strickland identified at least six freight disruptions since 2016, calling the current period among the most prolonged unusual stretches in modern freight history.
- West Coast van and refrigerated markets, particularly Southern California and Ontario, are the most volatile regions to watch amid an ongoing port strike.
This Summary is generated thanks to a transcription of the interview, for the full interview please enjoy the video above.