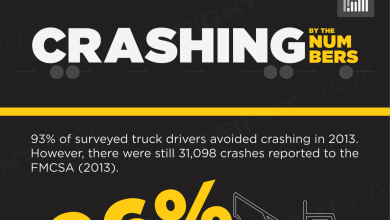
Infographic: Crashing – By The Numbers
The American Transportation Research Institute (ATRI) released its third Crash Predictor Model study. We’ve pulled the highlights into our latest infographic.
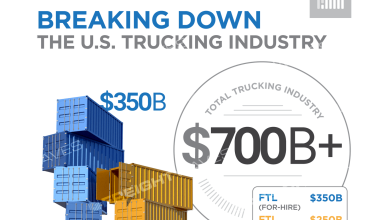
The U.S. trucking industry is huge. To provide a clearer picture of the industry as a whole, we’ve created an infographic.
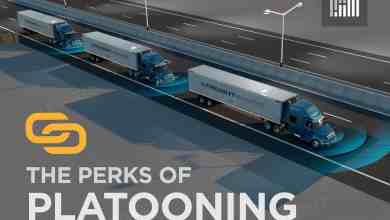
Ready or not, truck platooning is inching closer to reality. Our latest infographic highlights the primary benefits of platooning technology.
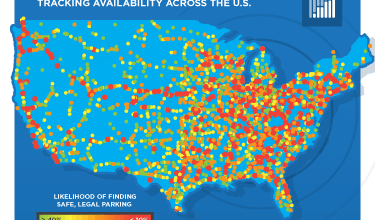
We pull out the key findings from Trucker Path’s 2018 Truck Parking Report to shine a little more light on the country’s parking problem.
In case you missed it, we’ve compiled some of the highlights from Transparency18 into one Infographic.
Happy Mother’s Day! Ever wonder how all those flowers get to mom? This infographic shows how Holland does its part.
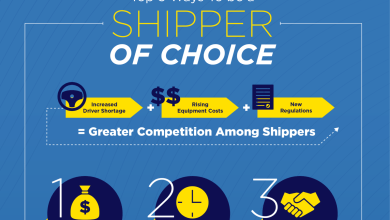
Becoming a “shipper of choice” is a decision. It doesn’t just happen. This infographic highlights 5 ways shippers can achieve this elusive title.
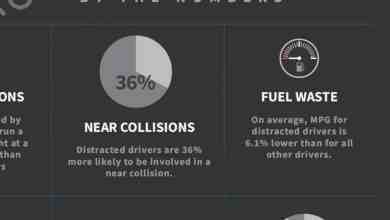
Just how dangerous is driving while distracted? Our latest infographic will help you get a better idea.
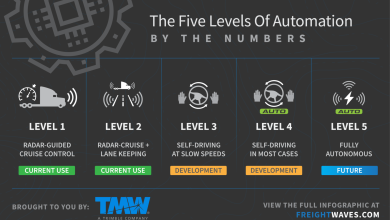
Vehicle automation can be a complex topic. This infographic can help you differentiate between the five different levels of self-driving cars.
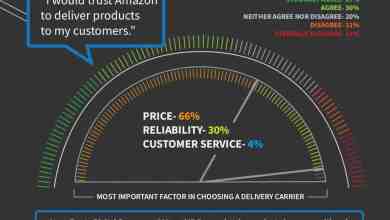
From a merchant perspective, Shipping with Amazon would provide increased competition in the shipping space, while also providing Amazon with more data about the products people are buying.
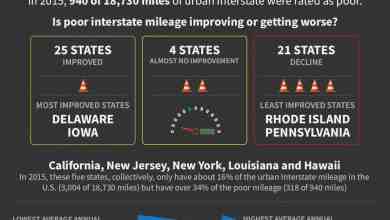
Congratulations to New Jersey for the absolute worst congestion and by far the worse disbursement per mile!
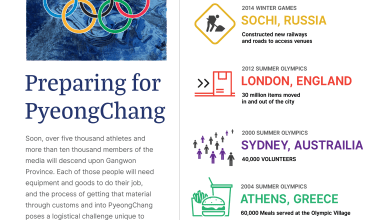
With the PyeongChang Winter Games opening ceremonies on Feb. 9, we wondered what kind of logistics operation it takes to make the Olympic Games run smoothly? We break down some of the numbers from past Games in this infographic.
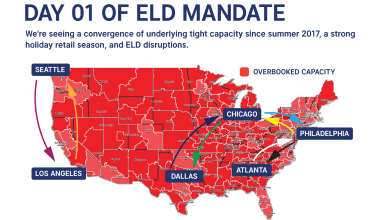
ELD fine enforcement hit during peak holiday retail season. Watch out for April’s ‘hard enforcement’ period, which will coincide with increased agricultural and construction demand.
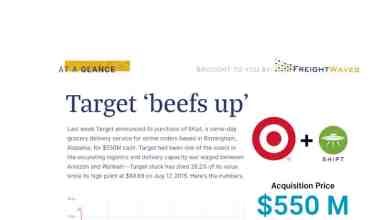
Target acquired same-day grocery delivery service Shipt for $550M in a bid to boost its online food sales and compete with Walmart and Amazon. Our infographic compares the performance and recent investments made by the three companies.
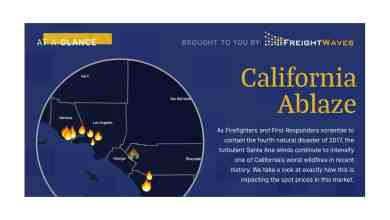
The out-of-control wildfires burning in California have had a dramatic impact on spot rates in the region.
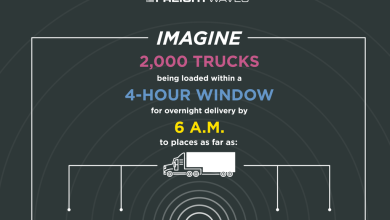
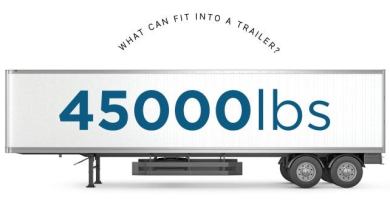
Trucks drive everyday down the highways of America and no one really knows what’s in those trailers. FreightWaves created this infographic to give you an idea of what could be inside that trailer.
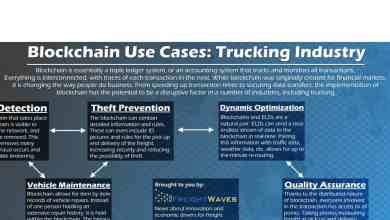
Blockchain is a technology that is rapidly growing in many industries, and its potential to disrupt traditional work flows in transportation is large. This graphic illustrates some of the potential areas where blockchain can be used to improve operations.
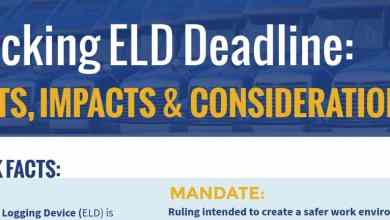
Many larger carriers already require their drivers to use ELDs, but for smaller carriers that make up the majority of the industry, the implementation of ELDs and their associated cost could be a game-changer. This infographic highlights some of the key facts around ELDs, their impact on operations, and potential solutions to mitigate those impacts.
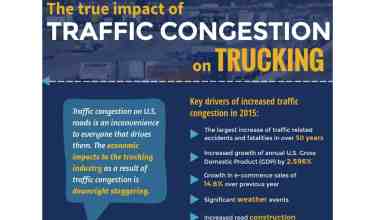
In 2015, the trucking industry experienced over 996 million hours of delay because of congestion, which is equivalent to 362,243 commercial truck drivers sitting idle for an entire working year, at a cost of $63.4 billion. Here are some more facts about congestion.
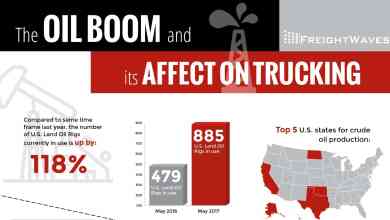
The recent surge in U.S. oil drilling has helped keep gas and diesel prices depressed, despite oil production cuts by OPEC. This infographic provides a quick glimpse of what is happening in the sector.