


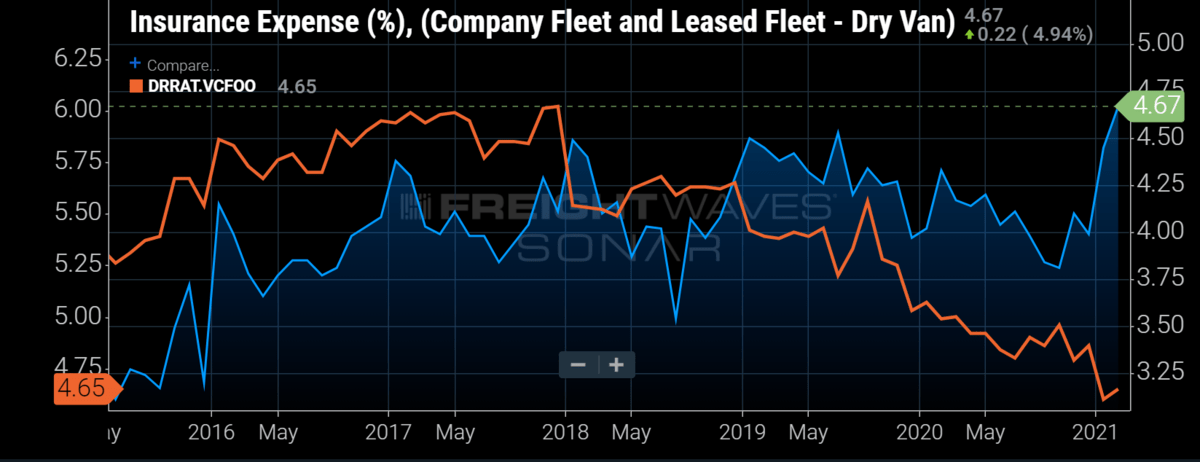
Chart of the Week: Insurance Expense % – Dry Van Company and Leased Fleet, Driver to non-Driver Ratio – Dry Van Company and Leased Fleet SONAR: INSURE.VCFOO, DRRAT.VCFOO
Driver recruiting problems are limiting carrier growth while the cost of operating is growing at a faster rate than ever. A similar scenario played out at the end of the 2017-18 freight boom. Cost inflation from insurance, maintenance, equipment and wages lasted beyond the yearlong freight boom that saw spot rates surge to all-time highs for an unprecedented amount of time. Capacity flooded the space and demand ceased to grow as the overstimulated market took a breath. With a similar scenario playing out in 2020-21, carriers need to be mindful of the lessons of the past.
For those who have not been watching, freight demand exploded in the back half of 2020, leading to shippers bidding up transportation rates to record levels on nearly every mode.
Containers that cost $1,400 to ship from China to Los Angeles in 2019 now cost nearly $5,000, according to the Freightos Baltic Exchange.
The $2,000 cost to move a container by rail from Los Angeles to Chicago in late 2019 is now as much as $4,800, according to FreightWaves’ Intermodal Spot Rate Index.
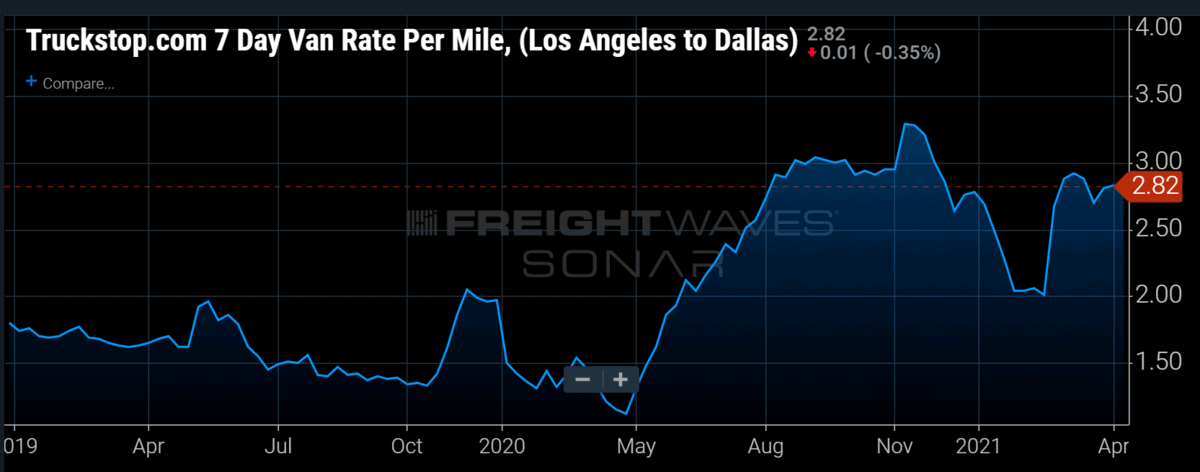
And the highly liquid Los Angeles to Dallas lane now costs $4,000 versus $2,000 in October 2019 for a dry van truckload on the spot market, according to Truckstop.com.
While these increases may seem like a boon to onlookers and carriers, there are pressures on rates other than shippers bidding for capacity. Driver recruiting tends to get the headlines for leading the charge, and rightfully so. Drivers are the product that is in short supply. Other inputs in the process, such as insurance and maintenance, do not occur without the driver in place.
According to Truckload Carriers Association (TCA) data that leans towards representing small and midsize carriers, the driver-to-nondriver ratio hit an all-time low of 4.6 this year. This value was as high as 6 at the end of 2017.
Granted, this value can be diluted by more back-office hires, but the ratio plummeted 26 basis points to start the year and has not recovered, even as capacity remains tight. Carriers are having to increase wages by as much as 20% in some cases to help fill the seats.
The big cost story for carriers before the pandemic was insurance premiums. While carriers are struggling to keep up with demand their insurance costs have taken a leap as a percent of revenue. The TCA data shows insurance cost as a percentage of revenue taking a 16% jump in the first two months of 2021.
This number can be influenced by increasing reserves set aside for the increased risk that comes along with being on the road more and traffic increasing once restrictions have loosened. Regardless, more movement and congestion will increase the risk of accidents.
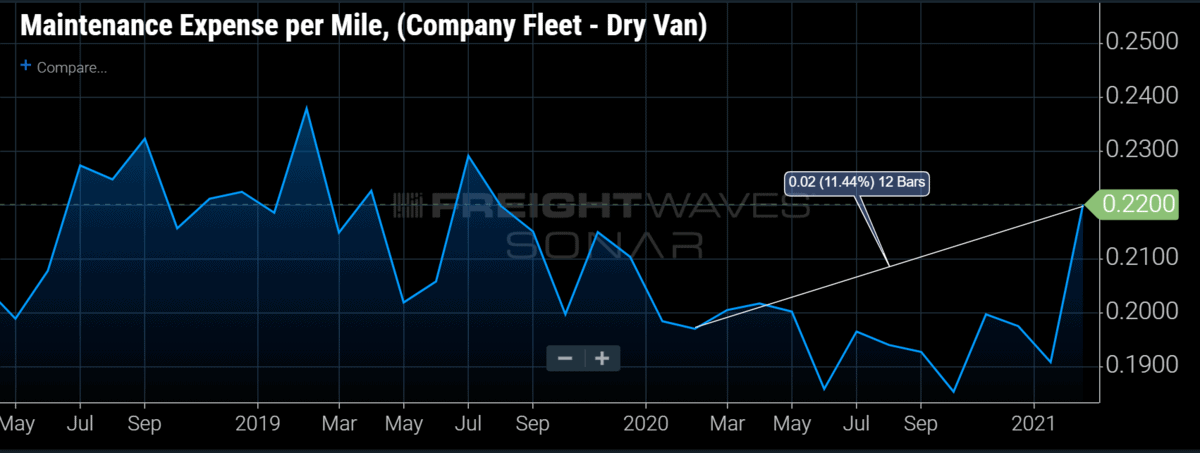
More driving also means more maintenance. Even with Class 8 orders hitting record numbers, it will be months before these are able to hit the road. This means trucks will run at higher mileages and need more maintenance. Maintenance costs have increased 11% over the past year, according to the TCA data.
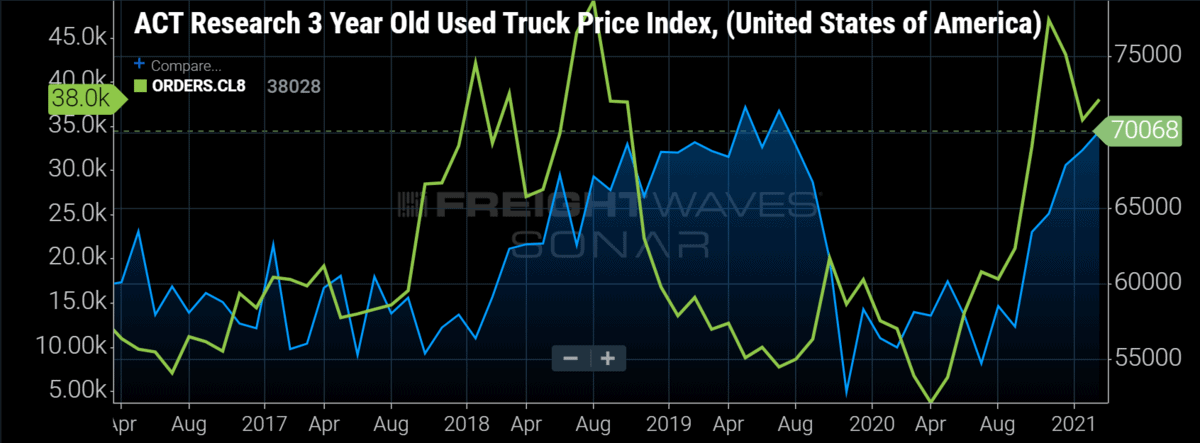
Used truck prices have also surpassed 2018 levels, meaning carriers are spending more for older equipment to try to meet added demand. Spending more for older equipment that will need more attention than new vehicles will add to the cost inflation that persists into the future.
Much like retailers who need their products on the shelves while demand is high, carriers also need to have trucks available to retain and gain customers. The difference is, the cost of trucks and employment per unit is more of a lasting expense, whereas inventory is mostly sunk and salvageable.
Adding capacity also dilutes the market and reduces upward pressure on rates. This is perhaps the strongest lesson from 2018 but one that is difficult to navigate if you are a carrier that wants to grow.
Sharp growth is rarely healthy or sustainable. Demand will ease and capacity will be added as the market moves towards equilibrium. The question remains as to how quickly this will happen and whether the pendulum will continue to swing wildly between under- and oversupply well into the future. Volatility comes at a high cost, and it normally persists longer than some of the more tangible ones.
About the Chart of the Week
The FreightWaves Chart of the Week is a chart selection from SONAR that provides an interesting data point to describe the state of the freight markets. A chart is chosen from thousands of potential charts on SONAR to help participants visualize the freight market in real time. Each week a Market Expert will post a chart, along with commentary, live on the front page. After that, the Chart of the Week will be archived on FreightWaves.com for future reference.
SONAR aggregates data from hundreds of sources, presenting the data in charts and maps and providing commentary on what freight market experts want to know about the industry in real time.
The FreightWaves data science and product teams are releasing new data sets each week and enhancing the client experience.
To request a SONAR demo, click here.

AJ
Carriers will need to pay much more than $1,000 per week.
Can get $1,000+ week unemployment in many states easy.
Stephen Webster
Many owner ops left in the last 28 months with low freight rates and problem getting insurance in Ontario Ca. Too many former sick truck drivers are currently unable to work. Nobody is looking out for truck drivers There is no shortage of truck drivers as most truck drivers are doing other things or got sick or injured.