


Though already present at a lane level in the Lane Signal application inside of the SONAR platform, FreightWaves has aggregated a national predictive rate value for van (FWS.USA) and reefer (FWSR.USA) modes and made them accessible to view historically and up to a year into the future. The national rates are averages of the over 700,000 lanes in the U.S. excluding lanes that are under 250 miles.
The main purpose of these rates is to provide increased visibility into the general direction of spot market prices for purchased transportation (shipper/broker to carrier) in the U.S. The basis for these rates is derived from a combination of data including but not limited to carrier costs, tender data, and demographic information. To learn more about the scientific rates and how they are formed click here.
Seeing as these rates are based on more than simply historical rate data, which would only lead to predicting seasonal movement. FreightWaves’ scientific rates use multiple data points and forecast each one out to a year. More relevant data ingested in the model leads to increased precision in the forecast.
Historical Predictions
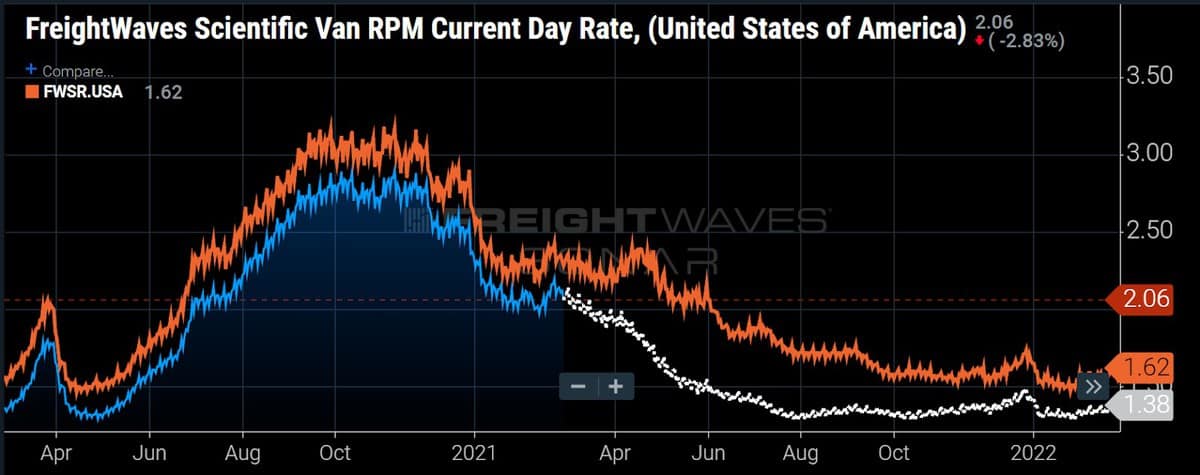
In addition to the base rate values for van and reefer, FreightWaves has also included the ability to plot the historic predictive values at the 7-day (FWS7.USA, FWSR7.USA) and 28-day (FWS28.USA, FWSR28.USA) points to see how accurate the predictive value was against the observed outcome.
While the predictive model used to generate forecasted rates is generated at the time the user requests it in the SONAR application, the new indexes are permanent recordings of 7 and 28 day forecasts, from the date they were generated. Each evening, the algorithm runs for the following 7 and 28 days and those numbers are recorded into the index. This is incredibly valuable for users that wish to backtest the predictive models against their own performance and provide a degree of comfort and accountability into FreightWaves Scientific predictive rate models.
The predictive rate model has become (and will continue to be) more accurate over time, as the algorithm feeds in more data and is backtested against customer experience and data. Regardless, the historical index won’t change. Consider it a 7 and 28 day rolling average of what was predicted in the model on the day referenced.

For instance if the Atlanta to Chicago lane had 10 loads at $1.40/mile and the Milwaukee to Chicago lane had 20 loads at $2.10/mile the weighted average of these two lanes would be:
(5 x $1.40 + 20 x $2.10)/25 = $1.96/mile.
In the straight average the calculation would weight each lane equally like this:
(1.40 + 2.10)/2 = $1.75/mile.
The weighted average gives the user another data point with which to evaluate market conditions and can alert the user to the increasing high RPM moves that can be hidden in the straight average. The weighted average is only available for van freight at the moment.
FreightWaves SONAR platform is constantly expanding. Interested in learning more visit here.
To request a SONAR demo click here.
