


Chart of the Week: Van Contract initial report base rate per mile, LTL Contract initial report average base rate per hundredweight – USA SONAR: VCRPM1.USA, LCWT1.USA
The freight market has been in a tailspin since the spring, but the less-than-truckload carriers are still increasing rates. Dry van truckload contract rates have fallen ~7% since June, according to FreightWaves invoice data. The same database shows about a 2% increase in LTL prices over the same time. Why do LTL carriers appear to be more insulated and will the market eventually catch up to them?
The LTL sector typically enjoys freight market upswings for longer stretches than its larger truckload cousin thanks to the lack of a strong spot market, annualized bid cycles and lack of fragmentation. While contract rates fell for truckload carriers in 2019, LTL carriers continued to garner strong increases until the market caught up with them later in the year.
While LTL represents half of the revenue of the truckload sector, the total volume handled is four to six times less. Truckload is like buying in bulk and has fewer touch points compared to LTL shipping, which inherently carries more cost and liability.
While the spot market tends to have a strong visible influence on truckload contract prices, LTL’s version is much smaller and less transparent, so it does not weigh heavily on long-term rate agreements. That being said, truckload spot rates can be an effective predictor of LTL rate changes over time.
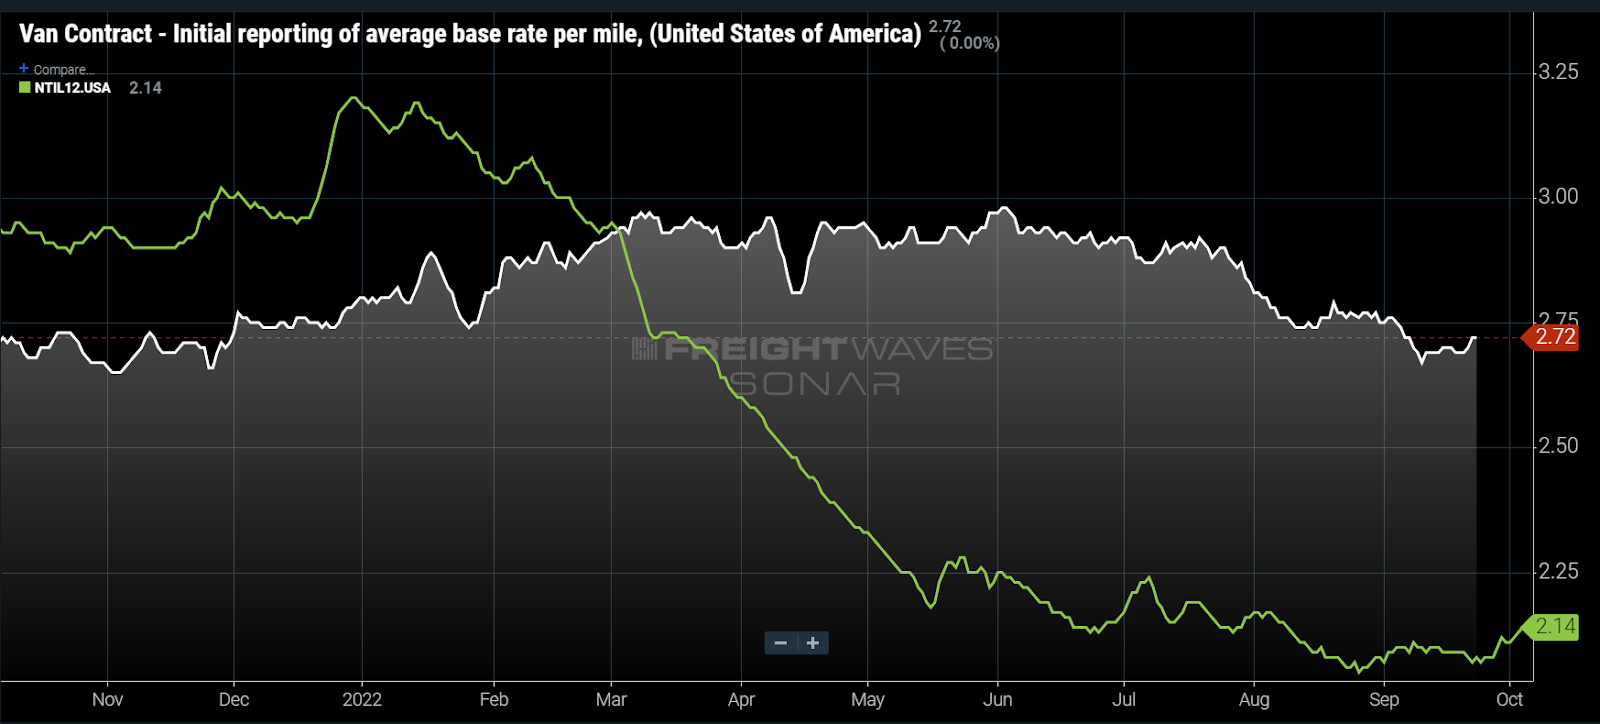
Spot rates excluding fuel costs above $1.20 per gallon (NTIL12) from dry van truckloads have fallen 27% since February, while contract rates have only declined 7% in comparison, flatlining from March through June. Long-term pricing is done with less frequency by nature and therefore moves more slowly, but many shippers shortened their bid cycles during 2020-21 due to low levels of contract compliance.
The process goes as follows in a tightening/inflationary cycle:
- Carriers cover fewer loads under contract rates.
- Shippers source more capacity on the spot market, paying a premium over contract.
- Contract rates get negotiated higher on an annual bid.
Carriers are now able to cover more loads under contracts and have more gaps in their networks and are now bidding against each other on the spot market, driving prices lower.
LTL networks are not as sensitive to missing shipments since they are smaller and the cost per shipment is much lower. They will just move trucks with less revenue on them versus being entirely empty. So there is less sense of urgency when the market turns.
The lack of competitors in the LTL space also keeps prices from dropping quickly. Barriers to entry are far greater than truckload.
Eventually, however, the market catches up to everyone. The truckload market is the bellwether for all domestic transportation since it is the most representative of the goods economy. But more connective than that, all LTL carriers ship truckloads. They consolidate smaller shipments into full truckloads and move them long distances. This is how they create value.
While not every LTL carrier uses outside truckload providers to move long distances between hubs, many do, making them a participant in setting the market rates. Eventually the market value for that capacity catches up to the LTL carriers, as it will this time. The only question is how long until it does.
LTL rates rose for about six to eight months after dry van rates started their initial decline in 2019. That cycle transition was far less severe than this one appears to be, suggesting that LTL contracts may reflect downward pressure before year-end.
About the Chart of the Week
The FreightWaves Chart of the Week is a chart selection from SONAR that provides an interesting data point to describe the state of the freight markets. A chart is chosen from thousands of potential charts on SONAR to help participants visualize the freight market in real time. Each week a Market Expert will post a chart, along with commentary, live on the front page. After that, the Chart of the Week will be archived on FreightWaves.com for future reference.
SONAR aggregates data from hundreds of sources, presenting the data in charts and maps and providing commentary on what freight market experts want to know about the industry in real time.
The FreightWaves data science and product teams are releasing new datasets each week and enhancing the client experience.