
This week’s FreightWaves Pricing Power Index: 75 (Carriers)
Last week’s FreightWaves Pricing Power Index: 75 (Carriers)
Three-month FreightWaves Pricing Power Index Outlook: 65 (Carriers)
The FreightWaves Pricing Power Index uses the analytics and data in FreightWaves SONAR to analyze the market and estimate the negotiating power for rates between shippers and carriers.
The Pricing Power Index is based on the following indicators:
Tender volumes surge past 2021 levels
Tender volumes come storming back after the holidays as the Outbound Tender Volume Index (OTVI) reaches the highest levels in nearly a month. OTVI has accelerated growth over the past week, exceeding what occurred in 2021.

SONAR: OTVI.USA: 2021-22 (blue), 2020-21 (green) and 2019-20 (orange)
To learn more about FreightWaves SONAR, click here.
Tender volumes are currently running 2.61% higher than in 2021, the widest the gap with year-ago levels has been (outside of holiday weeks) since mid-October. Since Sunday, OTVI has increased by over 7.5%.
Volume levels last week were still depressed due to the holidays, which is skewing the weekly comparison. OTVI is running up 24.9% week-over-week (w/w), but the comps will normalize in the coming days.
Accepted tender volumes continue to shine as rejection rates have pulled back over the past week and a half as drivers have returned to the road. Accepted tender volumes increased by 27% over the past week, largely due to the holiday noise associated with OTVI. Accepted tender volume levels continue to run over 5.5% higher than 2021 levels and will likely continue to outperform year-ago levels for the foreseeable future.
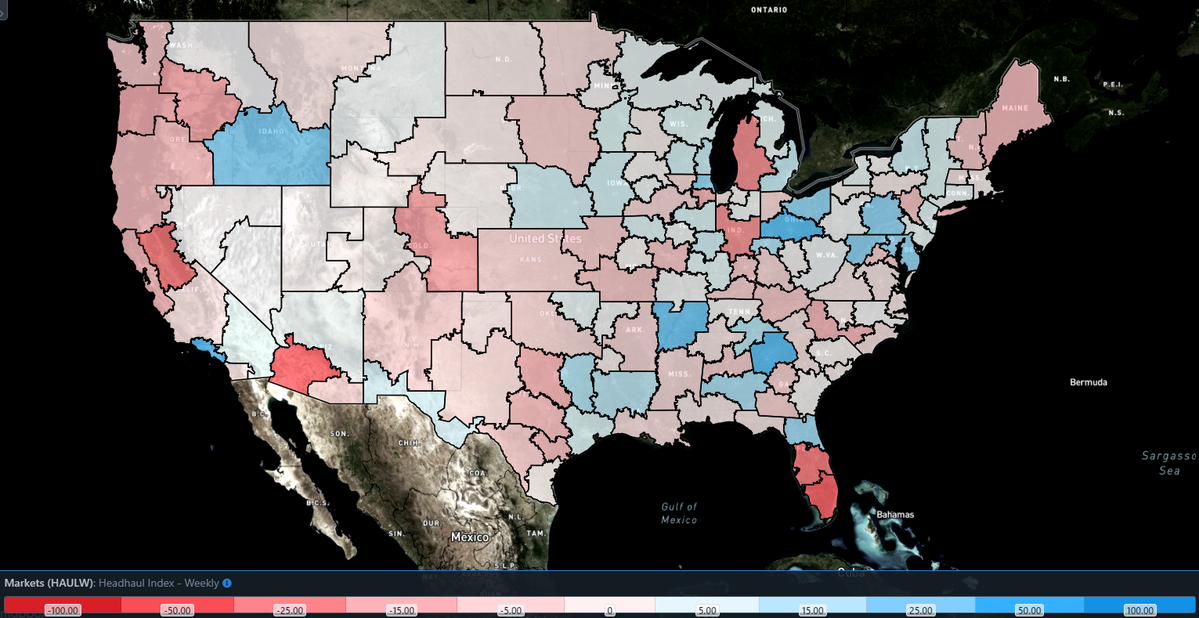
SONAR: Headhaul Index – Weekly Change (HAULW).
To learn more about FreightWaves SONAR, click here.
Weekly comps for volume levels across the markets are basically irrelevant at the moment because last week’s holiday-impacted data is still being factored in. Of the 135 freight markets, 132 reported increased tender volumes over the past week, with the vast majority reporting double-digit increases. Just Pendleton, Oregon, Augusta, Maine, and Bristol, New Hampshire, reported w/w declines in tender volumes.
A better metric to show volume changes is in the Headhaul Index (HAUL), which is the difference between OTVI and the Inbound Tender Volume Index (ITVI), both of which are affected by the holiday noise. The map above shows the weekly change in HAUL, where the blue markets are showing load imbalances intensifying. HAULW acts as a signal to where capacity is likely to tighten, and markets that have seen load imbalances intensify over the past week include Los Angeles, Chicago, Harrisburg, Pennsylvania, and Atlanta.
By mode: The Reefer Outbound Tender Volume Index (ROTVI) continued to climb over the past week, increasing another 13% w/w. The increase comes as comps are quite easy but should become increasingly difficult in the coming days. ROTVI still remains depressed compared to 2021, currently down 1.79% y/y. Reefer volumes have been able to close the gap with 2021 levels over the past month after the gap had widened to nearly 20% in mid-November.
Like ROTVI, the Van Outbound Tender Volume Index (VOTVI) experienced a more drastic increase, rising 28% w/w. Van volumes have turned positive on a y/y basis for the first time, outside of a holiday-affected week, since early October. The outlook for van volumes during a seasonally soft period for freight remains quite strong, especially as the backlog at the Southern California ports lengthens and warehousing capacity in the area is essentially sold out.
Rejection rates finally slide as drivers return to the road
Capacity is returning to the market, but that hasn’t brought any true relief to shippers. The Outbound Tender Reject Index (OTRI), which is a measure of relative capacity in the market, fell by 128 basis points (bps) over the past week. This was the single-largest weekly decline since the middle of July 2021.

SONAR: OTRI.USA: 2021-22 (blue), 2020-21 (green) and 2019-20 (orange)
To learn more about FreightWaves SONAR, click here.
The return of drivers to the road following the holiday has been slower than in previous years, likely due to drivers being able to take extended holidays after earning record revenue in 2021.
Even with the pullback in rejection rates over the past week, shippers are still faced with the difficulty securing necessary capacity. Rejection rates have remained over 20% for much of the past 18 months, with a brief exception at the beginning of December 2021. Rising contract rates have been unable to drive compliance levels back into manageable levels.
Ultimately, where do rejection rates go from here is tough to determine. Contract rates are likely to continue being repriced higher throughout the year and demand isn’t going anywhere, so the capacity conditions in the market are likely here at least through the first half of the year.

SONAR: WRI (color)
To learn more about FreightWaves SONAR, click here.
The map above shows the Weighted Rejection Index (WRI), the product of the Outbound Tender Reject Index — Weekly Change and Outbound Tender Market Share, as a way to prioritize rejection rate changes. With capacity tightening around the country, there are a lot of blue markets, which are the markets to focus attention on.
Of the 135 markets, 46 reported higher rejection rates over the past week, despite drivers returning to the road.
Where is the capacity going?
Markets like Ontario, California, Detroit and Salt Lake City have experienced tender rejection rate increases over the past week. Rejection rates in Ontario declined by 103 bps over the past week, while in Detroit and Salt Lake City, rejection rates fell by 664 bps and 881 bps, respectively.
Capacity is being starved in Baltimore, a market experiencing a rapid increase in tender volumes over the past week. Tender rejection rates in the market increased by 520 bps w/w, the third-largest increase over the past week.

To learn more about FreightWaves SONAR,click here.
By mode: Reefer capacity is still the toughest equipment type to recover as rejection rates remain near 40%. Over the past week, reefer tender rejection rates declined by 240 bps w/w to 38.76%. Overall, as the winter months are still here and severe winter weather is a risk, reefer capacity is likely to be quite difficult to secure, especially the closer the beginning of produce season gets.
The decline in van rejection rates over the past week was more modest as the Van Outbound Tender Reject Index (VOTRI) fell by 109 bps w/w. Van rejection rates continue to hover around 20%. The end doesn’t seem to be in sight either as congestion at the ports continues to mount, only leading to increased needs for capacity that is already being stretched.
The Flatbed Outbound Tender Reject Index (FOTRI) continues to decline after setting a fresh high right after Christmas. Over the past week, FOTRI has fallen by 420 bps to 26.49%. The inability to secure necessary flatbed capacity plagues the market, especially when compared to a year ago as FOTRI is nearly 1,500 bps higher y/y.
Both contract and spot rates set new all-time highs
The spot rate data available in SONAR from Truckstop.com is updated every Tuesday with the previous week’s data.

SONAR: Truckstop.com’s national spot rate (blue, right axis) and dry van contract rate (green, left axis).
To learn more about FreightWaves SONAR,click here.
The Truckstop.com national spot rate, based on the top 100 lanes on Truckstop.com’s load board, bounced back as capacity remained tight last week. The national spot rate increased by 2 cents per mile to $3.83, including fuel surcharge and other accessorials. The recent increase brought two consecutive all-time highs, breaking the previous high set around Labor Day.
Of the 102 lanes from Truckstop.com’s load board, 53 reported increases last week. Rates on lanes destined for Los Angeles all took steps backward last week as capacity returned to the large Southern California markets.
Contract rates climbed by 6 cents per mile over the past week at $2.80. Contract rates are reported on a two-week lag, so holiday impacts are starting to show up in the data. The recent increase brings contract rates to the highest level in the dataset that dates back to January 2017.
Contract rates, which are the base linehaul rate excluding fuel surcharges and other accessorials that are included in spot rates, are maintaining a similar gap as spot rates, running up 20% y/y.
FreightWaves’ Trusted Rate Assessment Consortium (TRAC) spot rate from Los Angeles to Dallas fell over the past week. The FreightWaves TRAC rate in this dense lane decreased by 15 cents per mile to $3.88. The falling spot rates are a result of capacity returning to Southern California following the holidays.

To learn more about FreightWaves TRAC, click here.
FreightWaves’ TRAC spot rate from Atlanta to Philadelphia continued to climb as capacity tightened in Philadelphia. The FreightWaves TRAC rate increased by 4 cents per mile to $4.02 over the past week.

To learn more about FreightWaves TRAC, click here.
As drivers return to the road following the holiday season, some of the upward pressure on rates will alleviate itself. Ultimately, pricing power will reside with the carriers, despite capacity being added to the market, as freight demand is unrelenting and the impacts of increased ocean bookings will keep demand elevated throughout the first quarter.
For more information on the FreightWaves Freight Intel Group, please contact Kevin Hill at khill@www.freightwaves.com or Tony Mulvey at tmulvey@www.freightwaves.com.
Supply Chain AI Symposium
Past the hype. Join operators, founders, and enterprise leaders figuring out how to deploy AI in supply chain.
F3: Future of Freight Festival
Industry-defining keynotes, rapid-fire technology demos, and industry leaders networking in experiences across Chattanooga - plus the inaugural F3 Awards Dinner featuring the FreightTech and Shipper of Choice reveals.
Past the hype. Join operators, founders, and enterprise leaders figuring out how to deploy AI in supply chain.
The Old Post • Chicago, IL Register NowIndustry-defining keynotes, rapid-fire technology demos, and industry leaders networking in experiences across Chattanooga - plus the inaugural F3 Awards Dinner featuring the FreightTech and Shipper of Choice reveals.
The Signal at Chattanooga Choo Choo • Chattanooga, TN Register Now