


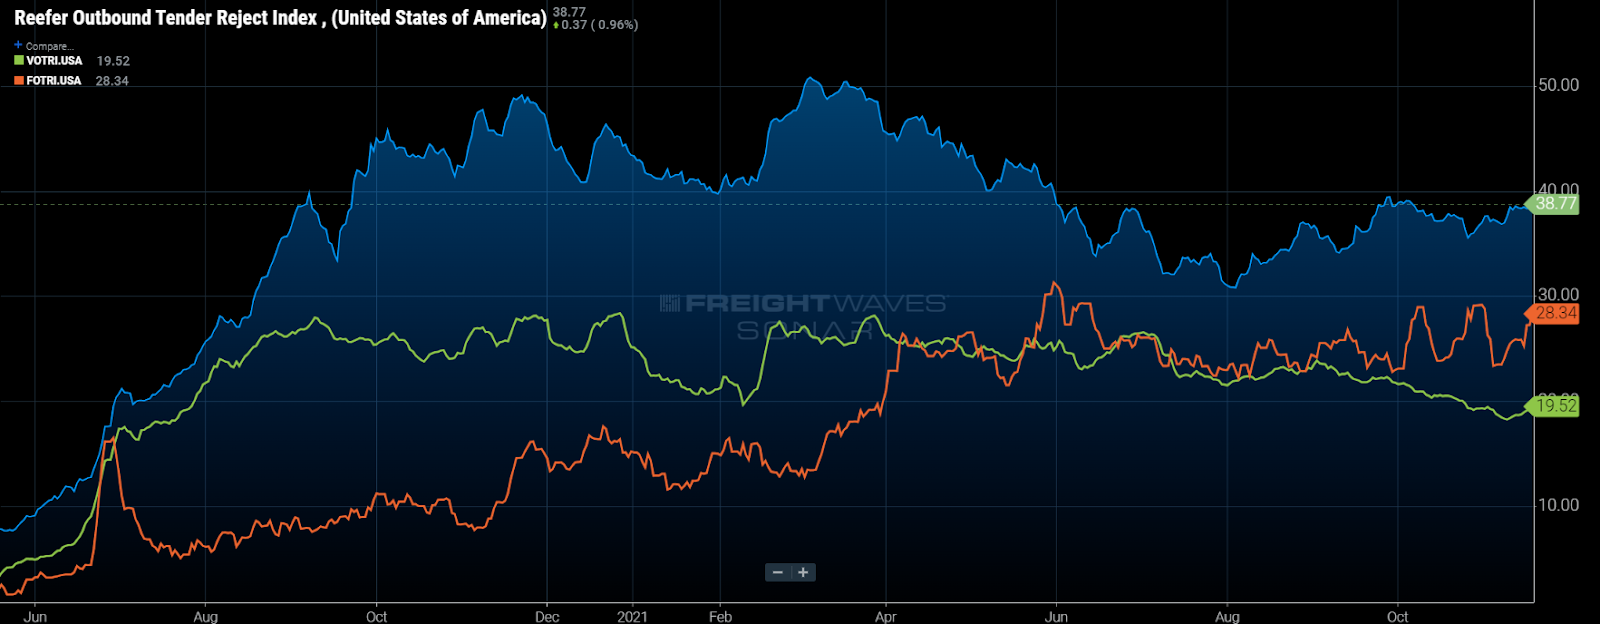
Chart of the Week: Reefer Outbound Tender Rejection Index, Van Outbound Tender Rejcection Index, Flatbed Outbound Tender Rejection Index – USA SONAR: ROTRI.USA, VOTRI.USA, FOTRI.USA
Refrigerated — or reefer — capacity continues to be the scarcest of the three main truckload trailer types heading into the holiday season. Reefer tender rejection rates, a measure of carrier compliance with higher values leading to more expensive prices, have increased by 8 percentage points since the first of August. In contrast, dry van capacity is showing signs of recovery before the holidays.
The reefer segment represents roughly 15-20% of the total contracted truckload demand, according to FreightWaves tender data. The commodities moved in this mode range from chemicals and industrial supplies that need to remain at a constant temperature to the widely publicized produce that moves in seasonal spurts.
The seasonal nature of the freight makes the sector extremely volatile, with capacity changing dramatically in relatively short periods of time. Over the past year it has been difficult to identify many if any seasonal fluctuations at a high level as demand has consistently outpaced the supply of available equipment.
Reefer rejection rates followed a similar pattern to dry van over the summer as they fell slowly from near 50% in March to 30% in early August. National van rejection rates fell from around 28% to 21% over the same time. Since then, reefer rejection rates have been on the rise while van has declined since Labor Day.

Spot rates for reefer loads, much like the recent trend in rejection rates, have also shown a slight divergence in direction from their van counterparts over the past few weeks. Reefer spot rates have increased from $4.06 per mile the last week of October to $4.08 last week, according to Truckstop.com’s top 100 lanes. Van spot rates have declined 5 cents per mile in the same time frame.
Reefer capacity is far more scarce in general, making it more sensitive to shifts in demand. Grocery supply chains remain in distress, with certain products experiencing uneven distribution cycles. While dry van freight has experienced similar inconsistency in shipping behavior, there has been little change in regional demand and directional flow of the freight.
Reefer freight seasonality tends to be more extreme, especially during harvest seasons. There are multiple harvests throughout the year for produce in the U.S. The majority of them occur in the fall, though the California produce in the spring can be one of the most disruptive to national capacity due to inconsistent weather conditions.
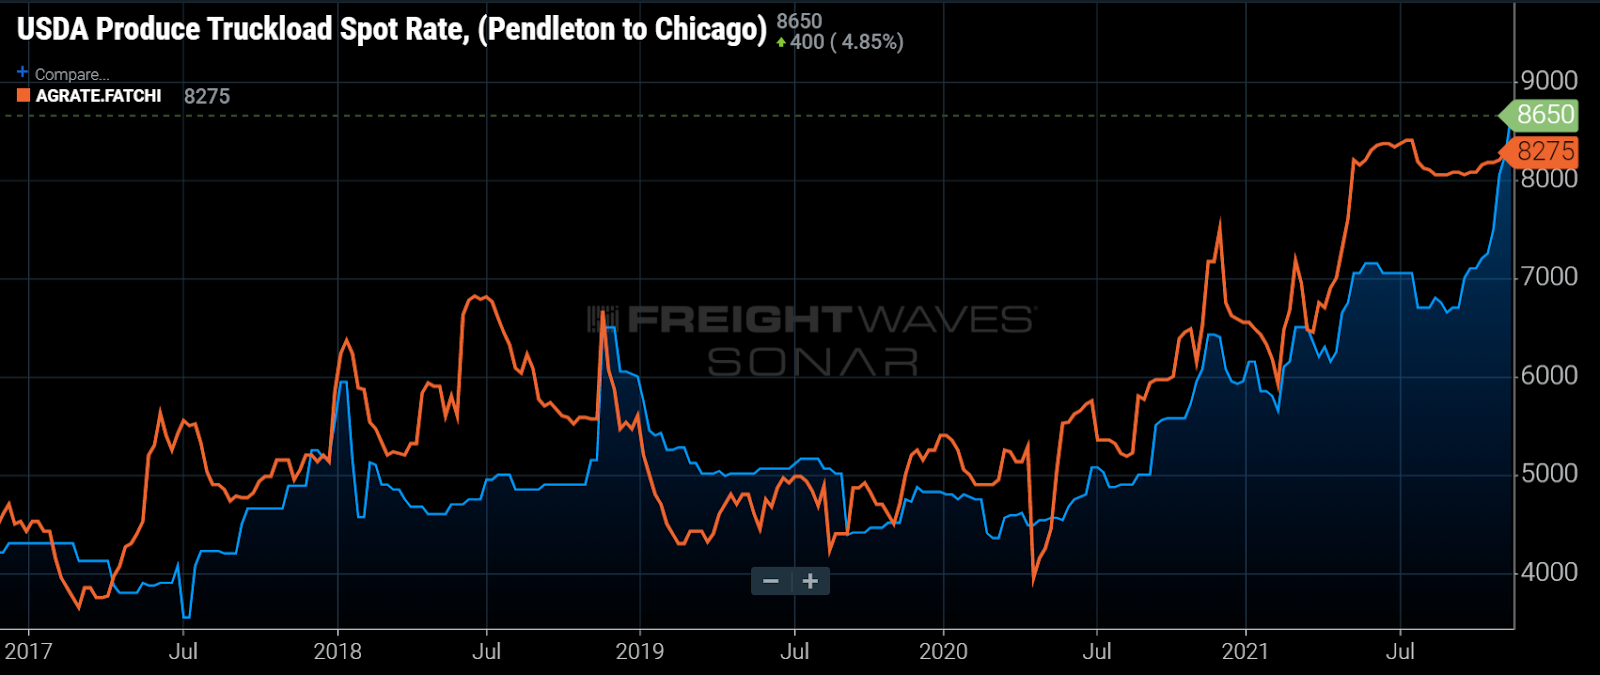
The fall harvests of potatoes and apples this year are having a profound impact on capacity in the Northwest as spot rates for produce moves are the highest they have been in recent years, hitting $8,650 all-in from Oregon to Chicago, according to the USDA, compared to $6,075 last year.
Farther south, produce truckload rates from California’s central district — where most of the nation’s lettuce is grown — are about at the same levels they were in the spring, though much higher year-over-year, indicating carriers are able to manage this area with a better level of consistency.
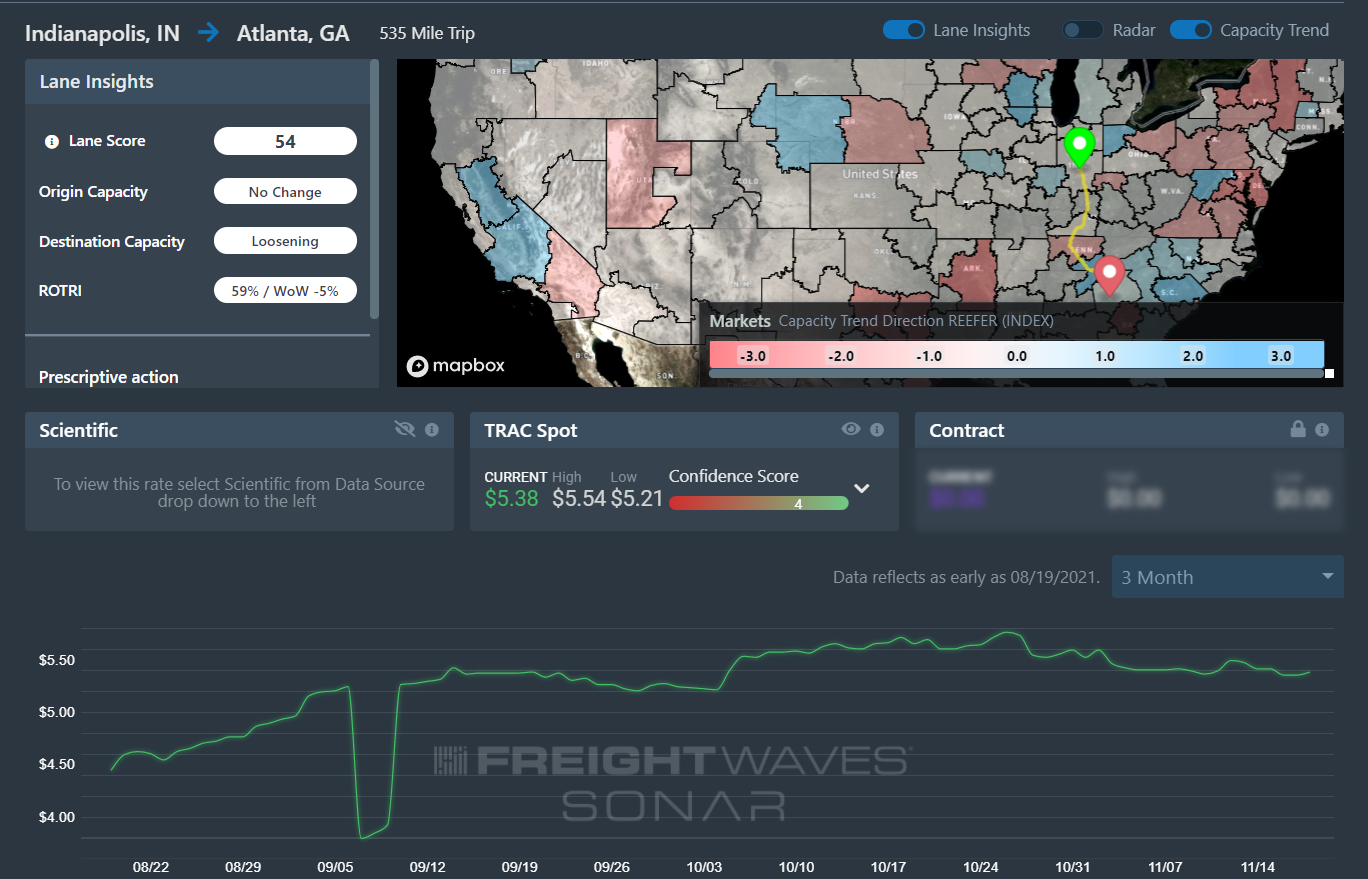
Farther east, where most of the harvests have already taken place, spot rates for reefer loads are a relatively mixed bag, but many showed increases this fall. Rates from Indianapolis to Atlanta have been significantly higher after Labor Day, according to FreightWaves TRAC. All-inclusive spot rates averaged around 20% higher in October than August, though some slight easing has occurred in November.
It is difficult to nail down exactly what areas are having the most difficulty as the diverging capacity and rate trend between van and reefer does not appear to be tied to any particular region or event.
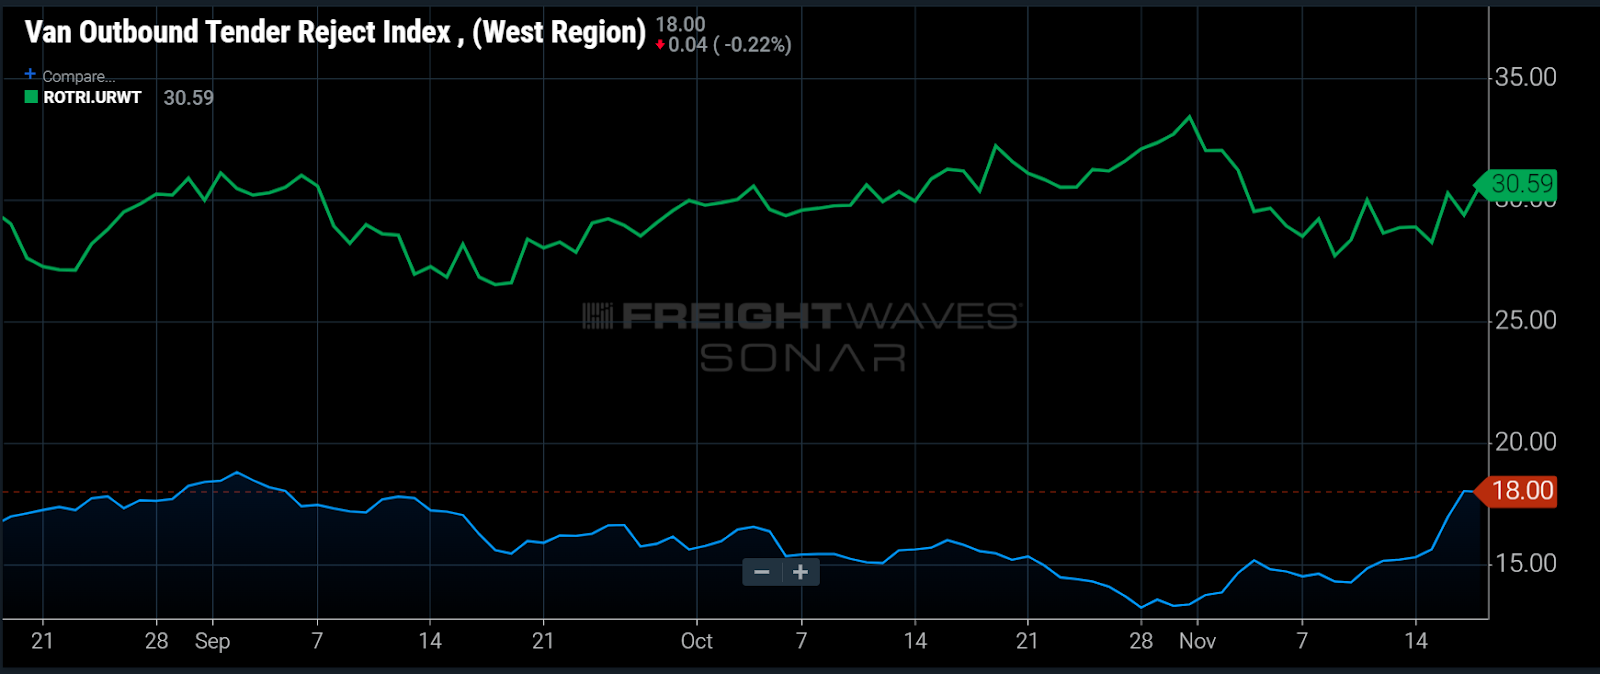
For the most part, it appears the predictability of van freight has allowed carriers to adjust their networks more effectively. At this point it is widely known that Southern California has plenty of freight to move back east. Until this past week, regional van rejection rates have been declining from the West while reefer rejection rates have been relatively steady over the past two and a half months.
While the holiday season will more than likely bring lower carrier compliance and higher spot rates to all modes, the refrigerated sector has not shown much evidence that capacity — and subsequently rates — will improve next year.
About the Chart of the Week
The FreightWaves Chart of the Week is a chart selection from SONAR that provides an interesting data point to describe the state of the freight markets. A chart is chosen from thousands of potential charts on SONAR to help participants visualize the freight market in real time. Each week a Market Expert will post a chart, along with commentary, live on the front page. After that, the Chart of the Week will be archived on FreightWaves.com for future reference.
SONAR aggregates data from hundreds of sources, presenting the data in charts and maps and providing commentary on what freight market experts want to know about the industry in real time.
The FreightWaves data science and product teams are releasing new data sets each week and enhancing the client experience.
To request a SONAR demo, click here.
Javier
It is challenging, moving trucks today is hard! But moving them on Friday looks pretty good post-holiday.
Yvonne Meister
I make more then $12,000 a month online. It’s enough to comfortably replace my old jobs income, especially considering I only work about 11 to 12 hours a week from home. I was amazed how easy it was after I tried it…GOOD LUCK..
HERE ➤➤ http://www.EarnApp3.com