


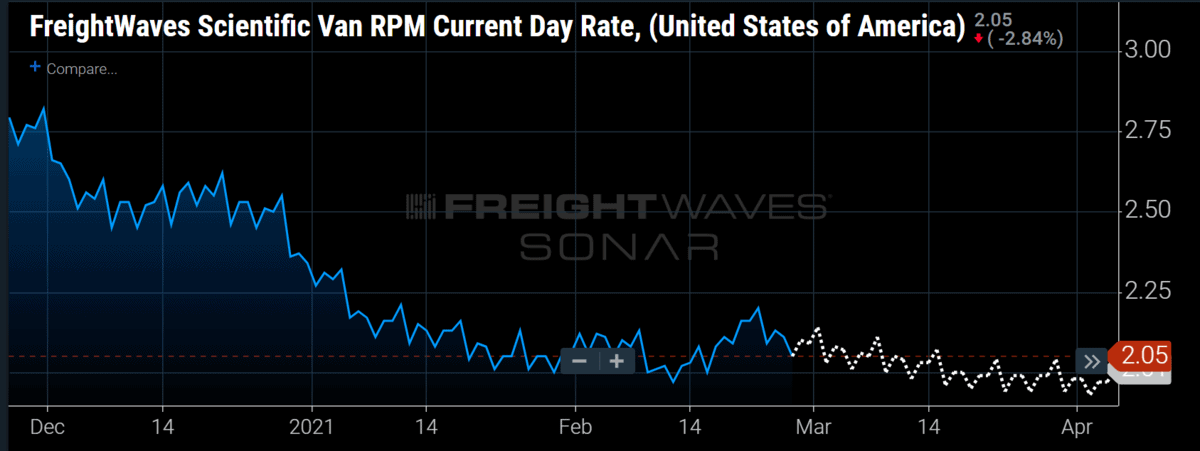
Chart of the Week: FreightWaves Scientific Van Rate per Mile – USA SONAR: FWS.USA
FreightWaves scientific rates are predicting a return to a slow downward trend after the impacts of the past month’s winter storms recede. The winter weather events of early 2021 have aided in keeping spot rates elevated through what is normally a slow season for trucking. The overriding trend prior to these storms was that of a slow loosening of the market.
FreightWaves scientific rates are not new, but the aggregated national versions are. The rates are derived from a combination of carrier costs, tender data and demographic information. They serve as a gauge that measures spot market direction both historically and into the future by as much as a year.
The lesson to be learned here is that the underlying fundamentals of the market are showing signs of moving slowly back toward a more stable scenario and spot rates may be unable to paint the full picture.
Reported spot rates have weakness in terms of measuring the freight market in the way they also measure emotion and subjective decision making. Pricing managers and brokers can keep rates elevated for longer than conditions suggest they should. One of these reasons is obvious: They do not see the underlying conditions. The other reason is that they need to.
That last line may sound a lot like the end of an evil villain speech, but the act of charging more than is necessary is not evil. Charging more is necessary in a business where every transaction has a good chance of losing money.
Both carriers and brokers have a responsibility to reduce the risk of losing money. The simplest way to do this is to charge more money when they can. This also helps them pay for the times when they have to sell below cost, either for utilization from a carrier perspective or a long-term agreement from the brokerage/managed transportation angle.
The trucking industry has spent most of the past decade in a state of oversupply, where carriers crawl over each other to offer the fastest service at the lowest rates. This long period of imbalance has perpetuated the mentality that shippers control the market most of the time. This puts a large strain on the relationship between the buyers and sellers of capacity, meaning it is always tenuous.
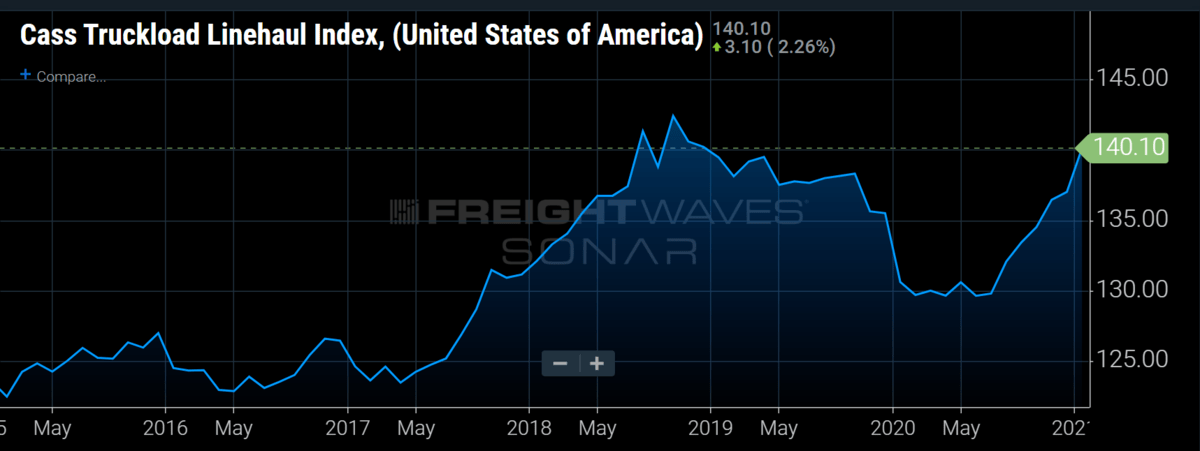
Over the past three years, trucking rates have behaved much more like a financial commodities market. Rates jumped in 2017-18 before collapsing in 2019 — and then COVID in 2020. Spot rates have become much more reactive because of this volatility, while long-term rate agreements have become nothing more than placeholders until the next disruption.
The scientific rates do not normally predict short-term disruptive events like the weather in February — adding weather by itself would overcomplicate the model for little return — but they can paint a clearer picture of what is happening beneath the surface.
Sellers of capacity do not have a consistent method of charging premiums during these events, meaning the outcomes are inconsistent and erratic.This practice makes comparing market swings difficult using spot rates alone. Scientific rates normalize the response to these conditions sort of like how Blue Book values are used.
The main purpose of Blue Book values is not to tell you what you should sell your car for but to put you in the vicinity, ignoring special improvements and/or defects. The scientific rates did not predict the winter weather disruption, but have ingested the information and pushed rates higher while extending the period of elevation.
All systems move toward equilibrium but spend little time there. The winter storms provided a sharp short-term disruption, but the impact will be minimal in a month’s time.
About the Chart of the Week
The FreightWaves Chart of the Week is a chart selection from SONAR that provides an interesting data point to describe the state of the freight markets. A chart is chosen from thousands of potential charts on SONAR to help participants visualize the freight market in real time. Each week a Market Expert will post a chart, along with commentary, live on the front page. After that, the Chart of the Week will be archived on FreightWaves.com for future reference.
SONAR aggregates data from hundreds of sources, presenting the data in charts and maps and providing commentary on what freight market experts want to know about the industry in real time.
The FreightWaves data science and product teams are releasing new data sets each week and enhancing the client experience.
To request a SONAR demo, click here.
