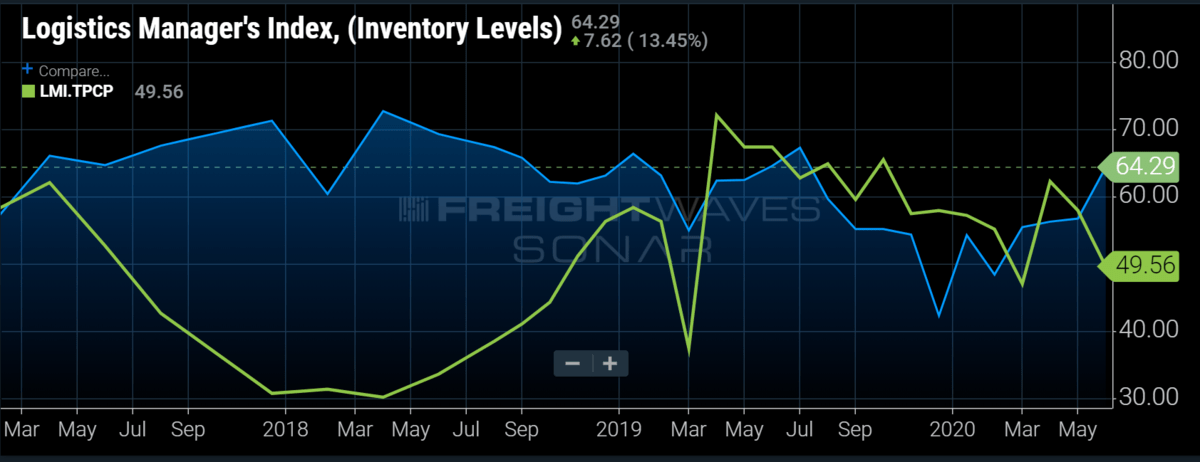
Chart of the Week: Logistics Managers’ Index – Inventory Levels, Transportation Capacity SONAR: LMI.INVL, LMI.TPCP
According to the June Logistics Managers’ Index (LMI), inventories are expanding rapidly while transportation capacity is in free fall. This pattern has not occurred with this level of significance since late 2017 when domestic transportation capacity was historically low, leading to the largest expansion in trucking rates in the past 15 years.
The Logistics Managers’ Index is a diffusion index based on survey data conducted by numerous logistics and supply chain schools across the U.S. measuring multiple aspects of the logistics space, focusing on warehousing and transportation.
The two components displayed measure inventory levels and domestic transportation capacity. The LMI is based on a scale similar to the Purchasing Managers Index (PMI), which is more focused on manufacturing. It ranges from 1-100 with values below 50 indicating contraction and those above 50 indicate expansion.
According to the most recent results, from June, the inventory level component increased from 56.6 to a stronger 64.2. Normally rapidly rising inventory levels indicate poor sales or declining demand. That would make sense except for the fact the transportation capacity figure fell from an expansive 57.87 to a slightly contracting 49.56, an indication that the domestic freight market is tightening and rates are increasing. If demand were soft, transportation capacity normally loosens as less freight moves.
If 2020 has taught us anything, it is that the world as we know it can change in an instant. Many connections between data points that were once reliable indicators are now broken.
The data points to shippers cramming warehouses full of freight as they simultaneously move it across the country. In other words, they are repositioning freight.
Dr. Zac Rogers, assistant professor of supply chain management at Colorado State University and one of the leads in compiling the LMI, talked about this on this week’s Freightonomics podcast, stating that many suppliers are diverting freight from a distribution center (DC)-style supply chain to a fulfillment center-oriented one. This is just one example of companies attempting to rapidly adapt to the socially distanced society as people order more from online retailers versus brick and mortar.
Another reason for increasing inventories stems from decline in demand for goods that are no longer as important, such as apparel. With people working from home and not going to school, there is less demand for luxury or premium clothing in lieu of more casual styles suitable for moving comfortably around the house, like athleisure. The mainstay of executive wear, Brooks Brothers, filed for bankruptcy earlier this month as wardrobe priorities shifted.
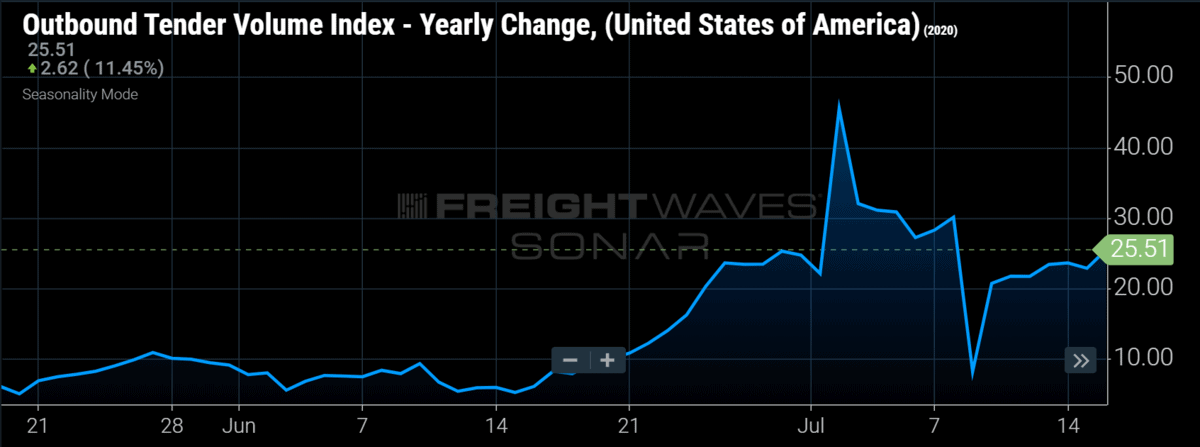
Freight volumes have expanded much more rapidly as a result of this shift in demand. FreightWaves’ Outbound Tender Volume Index remains 25% higher y/y as of Thursday.
Suppliers had no real warning that the country would be locked down and buyer preferences would change for as long as they have. Unlike other years when they could rely on school starting around August, they no longer can count on consumers’ seasonal needs being what they were in previous years. The unpredictable nature of the COVID-19 outbreak caused orders to spike as companies were out of position in the market.
Looking into the future, there are concerns about what this means. This “freight bubble” has a life cycle and once supply chains settle on a consistent solution that meets market demand, volumes will subside and transportation capacity will return. The problem with 2020 is that we are over four months into this unprecedented event and we have as much certainty as we had in the beginning.
About the Chart of the Week
The FreightWaves Chart of the Week is a chart selection from SONAR that provides an interesting data point to describe the state of the freight markets. A chart is chosen from thousands of potential charts on SONAR to help participants visualize the freight market in real time. Each week a Market Expert will post a chart, along with commentary, live on the front page. After that, the Chart of the Week will be archived on FreightWaves.com for future reference.
SONAR aggregates data from hundreds of sources, presenting the data in charts and maps and providing commentary on what freight market experts want to know about the industry in real time.
The FreightWaves data science and product teams are releasing new data sets each week and enhancing the client experience.
To request a SONAR demo, click here.
Brokerage Compliance Symposium
The day before F3. Every compliance issue you face - fraud exposure, carrier liability, FMCSA rules, cargo theft, insurance gaps - navigated by attorneys and operators defining best practices in a changing industry.
F3 Awards Dinner
The night before F3. FreightTech100 companies honored. FreightTech 25 and Shipper of Choice winners revealed live. Cocktail reception into dinner and live music - 300 industry leaders in one purpose-built room.
F3: Future of Freight Festival
Industry-defining keynotes, rapid-fire technology demos, and industry leaders networking in experiences across Chattanooga - plus the inaugural F3 Awards Dinner featuring the FreightTech and Shipper of Choice reveals.
The day before F3. Every compliance issue you face - fraud exposure, carrier liability, FMCSA rules, cargo theft, insurance gaps - navigated by attorneys and operators defining best practices in a changing industry.
The Signal at Chattanooga Choo Choo • Chattanooga, TN Register NowThe night before F3. FreightTech100 companies honored. FreightTech 25 and Shipper of Choice winners revealed live. Cocktail reception into dinner and live music - 300 industry leaders in one purpose-built room.
The Signal at Chattanooga Choo Choo • Chattanooga, TN Register NowIndustry-defining keynotes, rapid-fire technology demos, and industry leaders networking in experiences across Chattanooga - plus the inaugural F3 Awards Dinner featuring the FreightTech and Shipper of Choice reveals.
The Signal at Chattanooga Choo Choo • Chattanooga, TN Register Now