


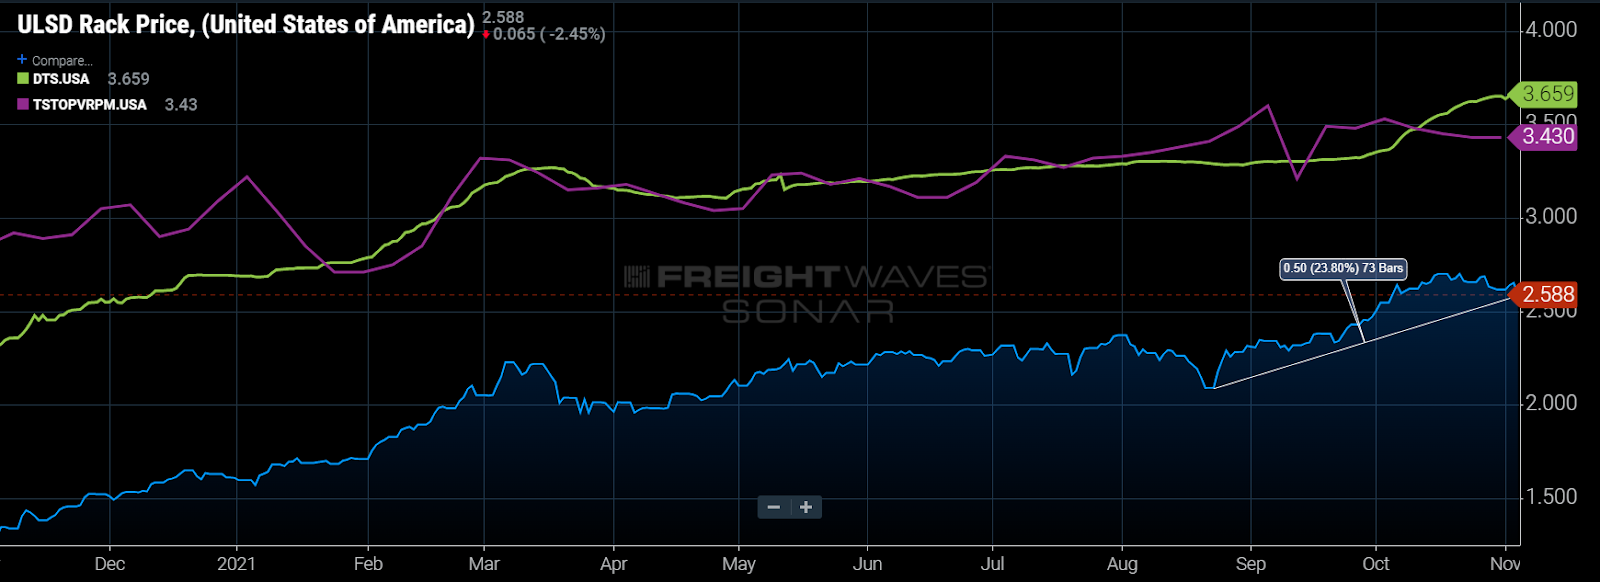
Chart of the Week: Ultra-Low Sulfur Diesel Rack Price, Diesel Truckstop Retail Price, Truckstop.com Average Van Rate per Mile – USA SONAR: ULSDR.USA, DTS.USA, TSTOPVRPM.USA
The price of diesel fuel has increased 23.8% since Aug. 23 while the average spot rate is on par with where it was prior to Labor Day. The big takeaway here is that spot rates would probably be falling more rapidly if not for the surging cost of fuel, but what does this mean for the upcoming holiday season for trucking?
Fuel costs have a huge impact on the price of a truckload — the second-largest operating cost on average behind a driver. It is also one of the most volatile. For a truck averaging 6.5 miles per gallon, when the price of diesel is $2.07 a gallon (the wholesale price on Aug. 23), the cost per mile is 32 cents. Raising the price to $2.588 (the price on Nov. 4) increases that cost 25%, to 40 cents per mile.
To overcome the cost variance potential, carriers implement fuel surcharges based on the average retail price of diesel reported by the Department of Energy for its contracted accounts. The retail price moves more slowly and less sharply than the wholesale price, which disconnects these two figures at times, which can either increase or decrease a carrier’s margin depending on the speed and direction.
While many spot market rates are quoted as all-in (inclusive of all charges), most carriers still utilize the same methodology for applying fuel charges to their loads by using a similar mechanism such as a cost table to apply a fuel cost. This charge is not really necessary to state explicitly in these instances, but it is definitely there.
The average retail price of fuel has increased 31 cents a mile (9%) over the past month, which should materially push rates higher, except they have actually declined about 2.4% for van loads.
Knowing carriers tend to use similar pricing mechanisms to include fuel costs in spot loads as they do contract, we can conclude that the spot market has actually softened much more than the overtly stated rate.
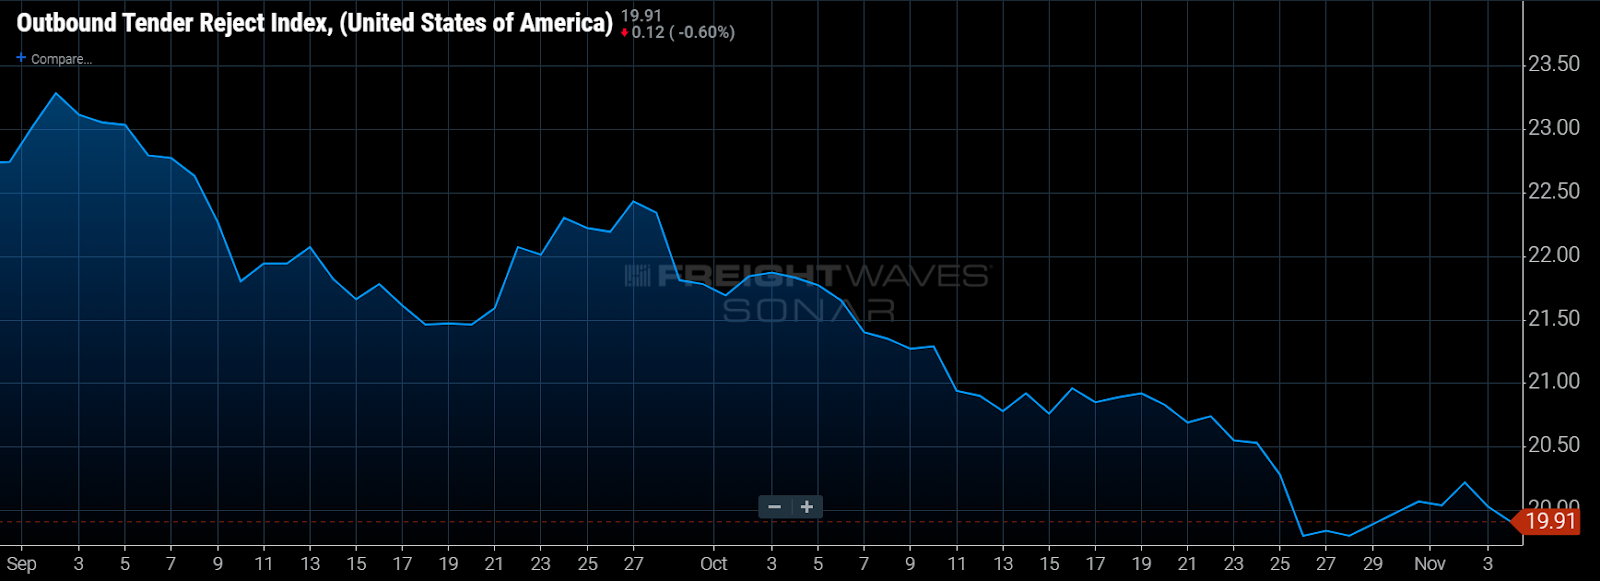
Spot rates are not the only market data showing easing signals; national tender rejection rates fell below 20% for the first time in over a year last week, indicating contracted rates are having more effect on keeping loads out of the spot market.
While this may be a sign that the freight market is slowly moving toward equilibrium in the long run, the holiday season where truckload capacity seasonally tightens every year is just around the corner.
During what is traditionally called “peak” season due to the huge rush of retail freight moving into stores and fulfillment centers, spot rates tend to increase dramatically. But demand is not the only factor as drivers also tend to take vacations and want to return home to see their families. This reduces the supply of trucks significantly.
While this season may look more like a bump than a peak thanks to over a year of increased consumer demand and a supply chain that still has multiple kinks, fuel cost inflation will keep upward pressure on rates outside of the market capacity conditions.
About the Chart of the Week
The FreightWaves Chart of the Week is a chart selection from SONAR that provides an interesting data point to describe the state of the freight markets. A chart is chosen from thousands of potential charts on SONAR to help participants visualize the freight market in real time. Each week a Market Expert will post a chart, along with commentary, live on the front page. After that, the Chart of the Week will be archived on FreightWaves.com for future reference.
SONAR aggregates data from hundreds of sources, presenting the data in charts and maps and providing commentary on what freight market experts want to know about the industry in real time.
The FreightWaves data science and product teams are releasing new data sets each week and enhancing the client experience.
To request a SONAR demo, click here.

Kevin
There’s a handful of states that may have diesel fuel at $2.58 a gallon and even that is a stretch 90% of all diesel prices in the country or well above $3 a gallon if not more……
There are a lot of fleets and owner operators that have a 50 to 70 cents a mile fuel expense depending on where they’re filling up in the country.