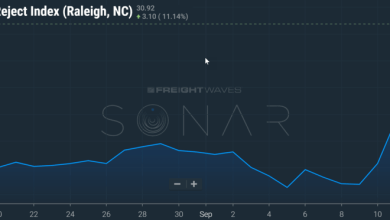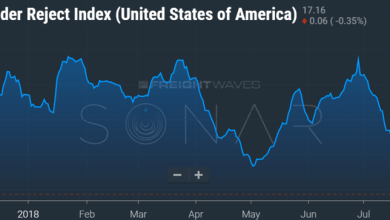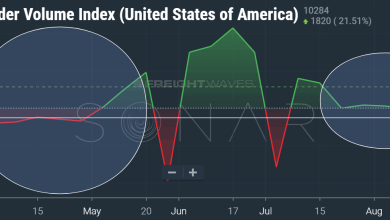
Freight volumes in the 3rd quarter have been stronger than the 2nd, it just doesn’t feel that way
For the trucking market, the third quarter has been stronger than the second, but no one would know it
It looks like the freight market is waking up from the long running summer doldrums, or is it just a byproduct of the pre-holiday shipper procrastination.
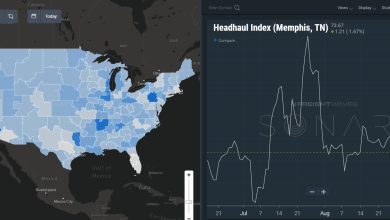
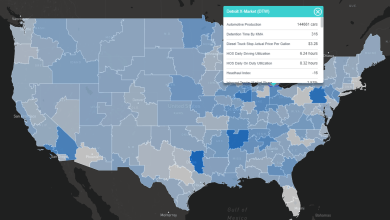
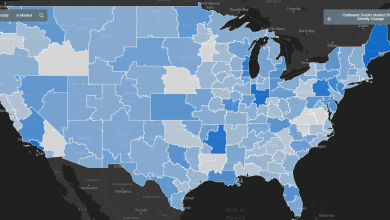
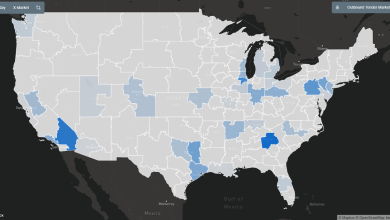
FreightWaves introduces new mapping features that make it easier to visualize data and heat maps across the freight market.
SONAR’s new index shows the cost difference for Asian exporters moving goods into East Coast or West Coast ports. When combined with trucking spot prices, the Panama spread helps explain recent shifts in trade flows.
Users that signup for a prepaid annual subscription to SONAR between now and the end of September 2018 will receive a LG 34” ultra wide curved monitor included.
Carriers and brokers have been talking about how slow August has been. Good news: According to our technical indicators, the market is about the turn back in their favor
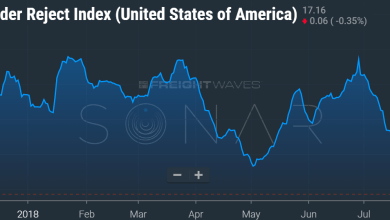
Volume falls this week in the freight markets but rejections are flattening indicating there are still some spots where capacity is an issue.
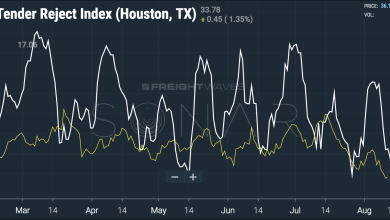
Tender rejection rates for reefer trucks outbound from Houston have oscillated wildly all year. Even compared to other regional markets, shippers and carriers are having a difficult time matching capacity to volume.
The impact of Nordstrom’s anniversary sale on logistics costs, college football and freight, drone deliveries in Canada, and much more in Today’s Pickup.
Amazon has promised to name a location this year for the so-called HQ2 project, which it claims will ultimately employ 50,000 people. Using SONAR, from a freight perspective, we’re here to help.
Slync, an intelligent platform redefining multi-party interaction, automation, and collaboration throughout the supply chain , has agreed to a multi-year partnership with FreightWaves, the leading data and content source for the freight market.
The top five trucking origin points represent 18% of the volume in the freight market, according to a new index added to SONAR this past week
The recent slide in spot rates is typical for this time of year, according to FreightWaves’ CEO, and data indicates another peak before Thanksgiving is possible.
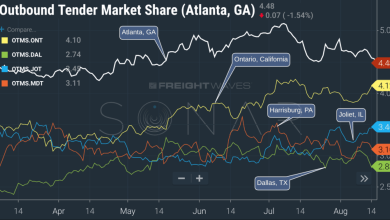
FreightWaves SONAR introduces market share indices to track relative volumes among US freight markets on a daily basis.
This week’s freight market continues the same patter toward stability, but volume remains steady as we move towards a more volatile time of year.
In the latest SONAR release users get a number of frustrations fixed, including chart scrolling, chart descriptions, and enhancements to the watchlist
Tesla’s auto production in Fremont and high container volumes out of Oakland are driving demand for trucks in the San Francisco market
With the recent chatter of a “housing crisis,” and the market reaching a “peak cycle,” we decided to take a closer look at what is going on.