SONAR participants get tender volume data in latest release
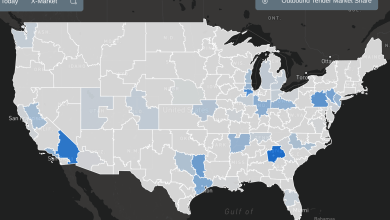
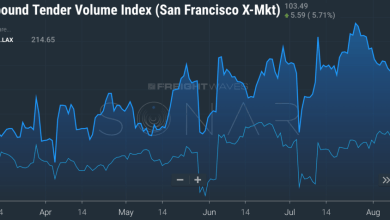
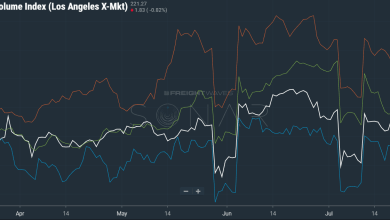
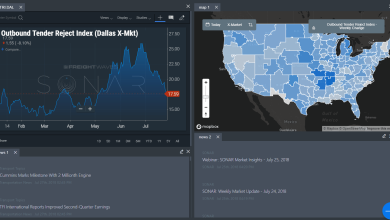
FreightWaves has introduced tender volume indices, giving market participants real-time data on freight volumes by market
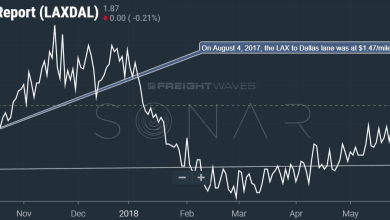
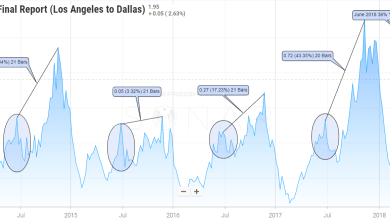
There will be a West Coast gold rush for trucking spot rates. SONAR data is suggesting that trucking spot rates will surge out of Los Angeles, reaching new highs.
In the latest SONAR release users get chart search enhancements, chart time series inputs, and a darker contrasting screen. Other updates include adding symbols to watchlist and ticker methodolgy tables.
Wall Street is in a panic over fears that the truckload sector has peaked. Wall Street is wrong. We break down the reasons using data from SONAR.
This week in freight showed more of the same with continued stabilization, but history tells us this may not last for much longer.
Introducing the latest additions to our SONAR platform: DAT lane pricing / Lane Tender Rejection Rates
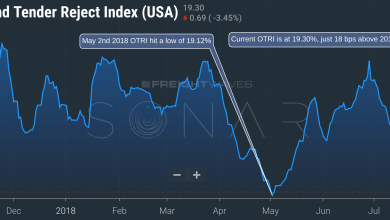
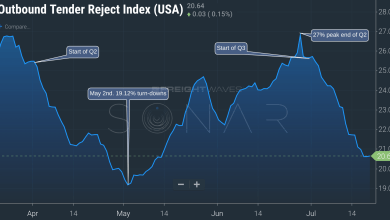
Tender rejections continue to fall towards the May 2nd low, indicating that capacity is loosening in the market. If it reaches the critical level of 19.12%, it could mean that the rest of the summer will be disappointing for carriers that reported a bullish summer outlook.
Fuel remains among the largest costs for both carriers and shippers but based on the current practice of using a fuel surcharge to mitigate volatility in pricing, both parties remain at risk of ending up on the losing end of the deal.
July has started off slower than carriers would like, showing normal freight patterns. Softer demand is also impacting utilization in the market.
The freight markets continue to cool, but looking at the bigger picture provides perspective on what to expect moving forward.
The agreement will cover around 25% of the global economy, and, according to Bloomberg, by some measures the largest free trade area in the world.
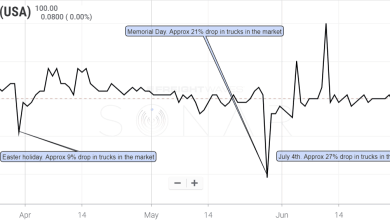
Holidays have a huge impact on the freight markets, with drivers going off-duty and altering their work schedules. In this chart of the week, we examined how different holidays impacted available capacity.
While there is a lot of noise surrounding tariffs and potential trade wars, it probably isn’t enough to derail the economy and the red-hot freight environment.
The story is clear: sales of all U.S. trucks has trended up for most of the year, new and used.
The freight markets took a slight break in the last few days, but this is nothing new and is not a sign of a turning market…yet.
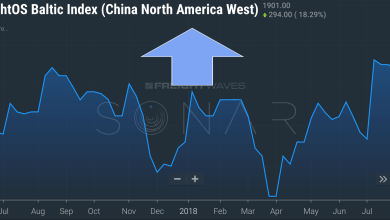
The Freightos Baltic Container Price Index shows the volatility of container prices out of China to the North American West Coast as importers try to adjust to a new era of global trade.
FreightWaves released an updated version of SONAR today that added thousands of new tickers to give market participants with better insights into the current state of the freight market.
The Cass Shipment Index (CFIS.USA) is showing freight market volumes that are nearly as strong as the 2006 peak season. This is a bullish sign for the second half of 2018.
The end of the second quarter was explosive in terms of freight market activity. Rates expanded as carriers refused loads. July typically sees volumes fall a bit in relation to June. There is no reason to think it will be indicative of any long run contractions in rates.