Today’s Pickup: more assertive EU signs massive trade deal with Japan
The agreement will cover around 25% of the global economy, and, according to Bloomberg, by some measures the largest free trade area in the world.
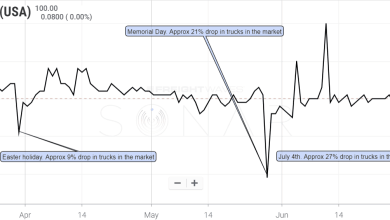

Holidays have a huge impact on the freight markets, with drivers going off-duty and altering their work schedules. In this chart of the week, we examined how different holidays impacted available capacity.
While there is a lot of noise surrounding tariffs and potential trade wars, it probably isn’t enough to derail the economy and the red-hot freight environment.
The story is clear: sales of all U.S. trucks has trended up for most of the year, new and used.
The freight markets took a slight break in the last few days, but this is nothing new and is not a sign of a turning market…yet.
The Freightos Baltic Container Price Index shows the volatility of container prices out of China to the North American West Coast as importers try to adjust to a new era of global trade.
FreightWaves released an updated version of SONAR today that added thousands of new tickers to give market participants with better insights into the current state of the freight market.
The Cass Shipment Index (CFIS.USA) is showing freight market volumes that are nearly as strong as the 2006 peak season. This is a bullish sign for the second half of 2018.
The end of the second quarter was explosive in terms of freight market activity. Rates expanded as carriers refused loads. July typically sees volumes fall a bit in relation to June. There is no reason to think it will be indicative of any long run contractions in rates.
Freight markets still hot to close Q2; COSCO/OOCL merger approved by US, China; Tesla hits Model 3 production goal; CSX revives plan for intermodal hub in North Carolina; EU threatens retaliation over auto tariffs.
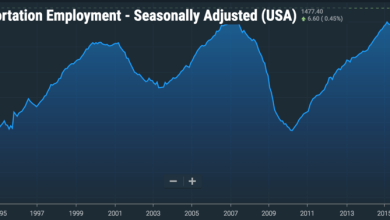
This morning, new SONAR indexes went live, giving a detailed look into load transmission acceptance by equipment type and length of all, and adding employment data for various transportation modes.
This morning, new SONAR indexes went live, giving a detailed look into tender rejections by equipment type and length of all, and adding employment data for various transportation modes.
Why, when capacity is so tight, is Chicago of all places overheated?
The Chainalytics-Cowen Indices are indicating a slowing freight market in April, but how does that help us in mid-June?
Zach Strickland, the “Sultan of SONAR,” curates the weekly market update.
FreightWaves is now offering the services of their analysts as a value-add to their SaaS Sonar service.
Rhode Island begins tolling trucks today; SCOTUS rejects review request by JB Hunt on California case; Rolls-Royce engine problems spread; transportation companies fret over tariffs; Waymo to buy up to 62,000 Chrysler Pacificas.
Roadcheck 2018 is now in full swing. Here at FreightWaves, we thought we’d examine the freight market data in SONAR–our SaaS platform that launched in beta on May 22nd–and see how inspections week is affecting the industry.
North American Class 8 truck orders have soared to an all-time high, according to preliminary data from May.
The recent clarification of personal conveyance rules have left some questions in the market about the expected impact. We go back to the data to make our own assessement.