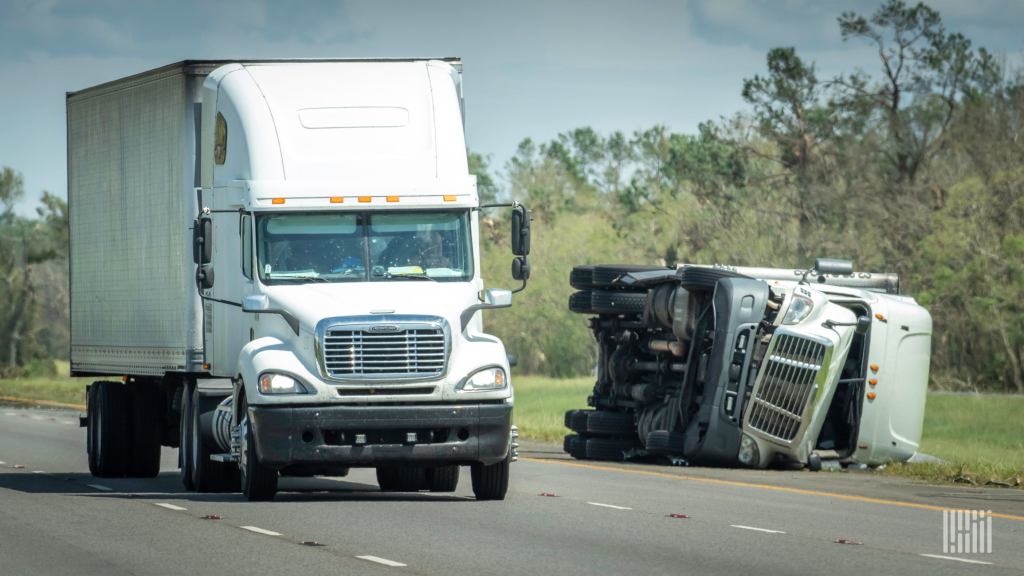
The ‘ingenious strategy’ behind most truckers’ least favorite week of the year: International Roadcheck

truck fallen over

International Roadcheck Week is hardly the sexiest topic in trucking, but it is a darn-tootin’ important one. Inspectors in the U.S. and Canada halt tens of thousands of trucks for vehicle inspections for a few days every summer or early fall. They remove thousands of trucks and drivers from the road; in 2021, 16.5% of inspected vehicles were put out of service along with 5.3% of drivers.

It’s uncommon for truck drivers to actually get their vehicles inspected at random during most of the year. To avoid International Roadcheck Week, many truckers simply don’t drive during that period of time — which, presumably, means more unsafe vehicles and drivers on the road outside of the inspection blitz. It’s a question that ate at Andrew Balthrop, a research associate at the University of Arkansas Sam M. Walton College of Business. 

Around 5% fewer one-person trucking companies are active during International Roadcheck Week. But Balthrop and his fellow researcher, Alex Scott of the University of Tennessee, found a major upside to the inspection blitz — even with all the folks who avoid it. According to their working paper published in March 2021, vehicles are safer a month before and after the inspection period. There’s a 1.8% reduction of vehicle violations, according to Balthrop and Scott’s analysis. Surprise inspection blitzes don’t result in the same uptick of compliance. 

I caught up with Balthrop about his research last week at FreightWaves’ Future of Supply Chain conference, and we chatted again on the phone this week about his findings on International Roadcheck Week.

Enjoy a bonus MODES and a lightly edited transcription of our phone interview: 

FREIGHTWAVES: For our readers who are not aware of what Roadcheck Week actually is, can you explain a little bit about what it and why it is important to drivers and companies?

BALTHROP: “The International Roadcheck is part of an alliance between the inspectors in Canada and the ones in Mexico and the U.S. to have a unified framework for making sure trucks are safe to operate. That should make it easier to go across borders when you have this kind of unified structure.

“In the U.S., one of these CVSA inspection blitzes is the International Roadcheck that happens for three days in the summer. Usually it’s a Tuesday, Wednesday and Thursday. And usually it’s the first week in June.

“And in it, they focus on Level One inspections, the North American Standard Inspection where they inspect the driver records, the hours of service, the licensure and I believe medical records as well. Then they inspect the truck. It’s an in-depth inspection where the inspector will actually crawl under the truck to look at various things. And these inspections, from the data that I’ve seen, take about a half an hour on average.

“During the Roadcheck Week, they’ll do about 60,000 inspections, so 20,000 a day. They’re going to pull over a lot of trucks, and this can cause a little bit of congestion at the weigh stations and the roadside inspections localities as the inspectors are doing these inspections.”

Roadcheck Week doesn’t catch all truck drivers, but it has a long-lasting benefit to safety

FREIGHTWAVES: So, can most drivers kind of expect to be pulled over? How likely is that?

BALTHROP: “There’s 1 million or 3 million trucks on the road, somewhere around there on any given day. With 20,000 inspections, most drivers still will not get inspected, but there’s going to be a higher proportion of drivers inspected. 

“You’re more likely to get inspected on these days. If you don’t have a recent inspection on your record, or if you have a bad recent inspection on your record, you’re more likely to be pulled over on these days.”

FREIGHTWAVES: Your research focused on that it’s just unusual that this inspection is announced, that it’s planned. We were talking before about how normally, if you’re trying to assure quality or compliance, you would not announce an inspection in advance. It would be more of a surprise-type situation. 

Can you walk us through why that’s so unusual, or what’s the rationale that you see behind announcing it in advance?

BALTHROP: “It is unusual, and on the surface, it doesn’t make much sense, but it turns out to be kind of an ingenious strategy. So I’ll walk through it here. 

“Over the course of a year, there’ll be 2 million inspections of 3 or 4 million trucks out there. The average rate of inspections is pretty low. It’s not uncommon for truckers to go years without having an inspection. With this low inspection intensity, the FMCSA has sort of a problem of, how does it get anybody to abide by the regulations?

“I’m a jaded economist, and I don’t worry or consider too much ethics and morality and all that kind of stuff. It comes down to incentives for drivers to follow these inspections. The incentives do guide behavior. So, how could the FMCSA incentivize drivers to follow these regulations more closely and adhere to the standards?

“They do this by announcing the blitz. This does two things. On one side, it allows everybody to prepare in advance. There’s a bunch of anecdotal evidence out there that people do prepare for these blitzes in advance. They will have their trucks inspected beforehand for any problems. They’ll time maintenance and upkeep in advance to make sure that their vehicles are in order. “They’ll be a little bit more cognizant of the driver-side regulations. One thing we notice in our study is that hours-of-service violations really drop during these extensions, because people see them coming. They don’t fudge the books in any way.”

Owner-operators can evade Roadcheck Week. Big carriers, not so much.

BALTHROP: “The issue with the announcement, on the flip side, is that it allows people to just dodge the inspection entirely. For a long time, people have talked about how owner-operators and smaller carriers time their vacations for this particular time. They could do this for a couple reasons. To avoid the hassle is a nice way to put it, but it also allows you to be noncompliant to avoid the high-intensity inspections.

“You have this balance here that on one side you get the behavior you want with people complying with regulations. That’s the behavior the FMCSA wants. But on the flip side, you get a bunch of people that are kind of outright dodging inspections.

“When you compare these two things on balance, the policy is actually pretty effective because you get a lot of people focused on maintaining their trucks and obeying the rules during that particular week. Especially with the vehicle maintenance stuff, that lasts a long time. 

“In our research, we saw that vehicle violations, a month before and up to a month afterwards, is when you still notice your vehicle violations. That trucks are kind of better maintained around these blitzes.

“The ingenious aspect of it is that the FMCSA, by concentrating their inspection resources all at one time and announcing it, they’re making it clear that they’re serious about enforcing these regulations and everybody prepares for it. For the number of inspections that are happening, you get fewer tickets than you would have otherwise expected.

“The FMCSA, they’re putting people through a little bit of a hassle, but they’re not having to write a bunch of tickets to get people to comply. They’re not really punishing a whole bunch of people because, by making this apparent that this is going to happen, people comply and the FMCSA gets what they want essentially without having to come down on carriers too hard.”

A convenient time for a vacation, indeed

FREIGHTWAVES: OK, interesting. And how does this pattern of shutting down, how does that compare for an owner-operator versus a driver for a big fleet?

BALTHROP: “If you’re a motor carrier with thousands of power units, you can’t just pack up and not do business on a particular day. They just don’t have that option. So they get inspected at a higher intensity, and you see the larger carriers kind of more focused on making sure that they’re prepared for these inspections. With so many inspections, the larger carriers are going to be inspected at higher rates. You can really damage your reputation if your equipment isn’t in order on this particular day. 

“Versus the smaller carriers, especially if you’re talking about a single-vehicle fleet, an owner-operator type, it is not that difficult to just not work for those three days. And so you see a lot about that. 

“In terms of what the roadway composition looks like, if we look at inspection data and relative to a typical day with the usual inspections, on these Roadcheck days, you have about 5% fewer owner-operators on the road than you otherwise would expect.”

FREIGHTWAVES: Wow. And when you say owner-operators, you also mean just like fleets with just —

BALTHROP: “One-vehicle fleets.”

FREIGHTWAVES: OK, that’s interesting.

BALTHROP: “You know, you see a little bit of effect with the smaller fleets, below six vehicles, but it basically disappears by the time you get to a hundred vehicles.

“This effect is being driven by smaller carriers staying off the road in terms of avoidance. You see this goes also how you would expect; it’s also older vehicles that stay off the road. This is correlated with carrier size. The larger carriers use newer vehicles and owner-operators tend to use some of the older vehicles. But it’s particularly the older vehicles that are off the road.

“This makes intuitive sense. Older vehicles are more costly to keep compliant. Maintenance is more costly, and they’ve been around longer so there’s time for more stuff to have broken essentially.

How a truck driver gets stopped for inspection

FREIGHTWAVES: Can you explain a little bit more, the idea of having this inspection history and why it would benefit a larger or small carrier?

BALTHROP: “Getting flagged for inspection is sort of random, but not totally. If somebody notices something obviously wrong with your truck, that’s ground for a more in-depth inspection. Or if you get pulled over for some other reason, this can be grounds for inspection of some type. 

“But there’s also the inspection selection service. The computer program that is random, that it randomly flags people in for inspection, but it’s based on your inspection history.

“So if your firm hasn’t been inspected recently, or if your carrier doesn’t have a very dense inspection history, you’ll be more likely to trigger that system to pull you in and have you inspected. If you have a dense inspection history, you’re less likely to get inspected.”

FREIGHTWAVES: So how do you get pulled over for inspection? As a person who only drives a passenger car, my main interaction with being pulled over is, I’m driving down the freeway or wherever, and I get stopped by the police. How does it work for a truck driver? How does getting pulled over or inspected work in that way?

BALTHROP: “The law is that you cannot pass a weigh station without pulling in and getting weighed. At that point they may flag you to be inspected. Now, in the past decade or two, there’s been a bunch of electronic devices that are installed in cabs. You may have heard of PrePass or Drivewise. This allows you to pass weigh stations. 

“I don’t have data on how many trucks have the in-cab devices. But from a trucking perspective, they’re so convenient that you don’t have to stop every time you cross a state line. I think the vast, overwhelming majority of trucks have some sort of one of these electronic devices. The DOT inspectors at these roadside inspection points have a dial they can twist essentially about how many people they want to inspect. 

“So during the roadcheck inspection week, they’ll crank that dial all the way up and pull everybody over. And if they get too backed up, they might crank it back down a little bit and so on.”

FREIGHTWAVES: OK, interesting. It reminds me of a highly sophisticated E‑ZPass.

A $10 million-plus expense to trucking companies every year … but it’s worth it if just one fatal crash is avoided

FREIGHTWAVES: Zooming out, when we hear about large truck crashes, something like a vehicle maintenance issue is not really the most sexy explanation. But just looking at the FMCSA data, in 29% of all truck crashes, a major factor is brake problems. So it seems like a lot of the truck crashes on the road are caused by vehicle maintenance, versus something like the driver using illegal drugs or some other sort of more dramatic explanation. Can you speak a little bit to why this sort of vehicle maintenance is important for safety in preventing large crashes?

BALTHROP: “We did a little bit of a back-of-the-envelope cost benefit analysis of this. Let me try and make sure I remember it clearly, but we have it in the paper that the cost of this on one side is that you have the compliance costs the firms are undertaking, and then you have to add to that the delay costs from doing this, and then the cost of the inspection itself, having to pay federal inspectors to do this.

“On the benefit side, it reduces crashes. So when we add up, just looking at the cost of what an inspection is, we don’t have a good idea of how to measure the compliance cost. It’d be fun to measure the delay cost, but I don’t have good enough price data on that to get at that cost. 

“But if you look at what the cost of an inspection is, it is something like $100 or $120 is what you would pay to have one of these inspections done privately. A lot of people do this in the run-up to inspections, and have it done privately so that you can fix whatever the problems are and be sure that you would pass the FMCSA inspection.

“With that $120 figure, if you aggregate that up to 60,000 inspections or whatever, and you take that in comparison, I’m going to give you a bad figure here, it’s on the order of $10 million. That is about the value of a statistical human life. Looking at this economically, it’s worthwhile if it saves one human life. If you identify just one faulty brake system that would’ve resulted in an accident, you’re getting some value out of the program. 

“When you add those other costs in there, we’re going to need to save a couple of lives, but in terms of cost benefit analysis with this kind of stuff, we’re usually looking at orders of magnitude differences in cost and benefits to say something for sure. 

“If you can save just a couple lives, this program will pay for itself.”

Time to start inspecting in the winter

FREIGHTWAVES: Then one last question: Is there any rationale for this program happening in the summer? 

BALTHROP: “I think part of it is that for the inspectors this gets much harder and much more miserable to do in winter conditions.”

FREIGHTWAVES: That makes sense.

BALTHROP: “Inspectors are less productive. One of the things that we talk about in the paper, that they have in addition to the International Roadcheck, is that they have Brake Week where they focus a little bit more on brake inspections. You have Operation Safe Driver a little bit later on in the summer, usually in September, where it’s a little bit more focused on passenger vehicles and how they drive around these trucks.

“But there’s not one in the winter time. There’s an unannounced brake check that usually happens in May, a surprise inspection that’s just one day. But you’re right in pointing out that it might be worthwhile having one of these in the wintertime. You have this periodic high-intensity inspection that kind of incentivizes everybody to be compliant through the summer. 

“But there’s nothing in the winter, so that’s an area. But if I was managing the FMCSA, that would be one of the first questions I ask, ‘Why don’t we have one of these in the wintertime?’”

FREIGHTWAVES: That makes sense. Maybe they can do it in the South or something. Maybe a Miami January inspection … 

That’s it for this special bonus MODES. Subscribe here if you’re not already receiving MODES in your inbox every Thursday. Email the reporter at rpremack@www.freightwaves.com with your own tales on International Roadcheck Week or any other trucking topics. 

Why the Northeast is quietly running out of diesel

The nozzle of a diesel fuel pump is inserted into the tank of a commercial truck as its driver looks on the bankground.

The East Coast of the U.S. is reporting its lowest seasonal diesel inventory on record. And some trucking companies appear spooked.

The East Coast typically stores around 62 million barrels of diesel during the month of May, according to Department of Energy data. But as of last Friday, that region of the U.S. is reporting under 52 million barrels. 

The sharp increase of diesel prices has been a major stressor in America’s $800 billion trucking industry since the beginning of 2022. According to DOE figures, the price per gallon of diesel has reached record highs — a whopping $5.62 per gallon. It’s even higher on the East Coast at $5.90, up 63% from the beginning of this year. 

When relief is coming isn’t yet clear, and experts say higher prices are the only way to attract more diesel into the Northeast.

“I wish I had some good news for the Northeast, but it’s bedlam,” Tom Kloza, global head of energy analysis at OPIS, told FreightWaves. 

2022 has seen record-setting diesel prices. (SONAR)

Everyday Americans don’t fill up their cars with diesel, but the fuel powers our nation’s agriculture, industrial and transportation networks. More expensive diesel means the price of everything is liable to increase. Trucks, trains, barges and the like consumed about 122 million gallons of diesel per day in 2020

Patrick DeHaan, a vice president of communications at fuel price site GasBuddy, reported that retail truck stops are hauling fuel from the Great Lakes to the Northeast, calling it “extraordinary.” We’ve also seen anecdotal reports from truck drivers posting company memos:

Pilot Flying J and Love’s, two of America’s largest truck stops, told the Wall Street Journal yesterday that they were not planning to restrict diesel purchases, but were monitoring low diesel inventory.

Not unlike every other supply chain crunch we’ve seen in the past few years, the cause of the Northeast’s diesel shortage is multifaceted. A yearslong degradation of refineries is rubbing against the Gulf Coast preferring to ship its oil to Europe and Latin America.

Here’s a breakdown:

1. The East Coast has lost half of its refineries. 

As Bloomberg’s Javier Blas wrote on May 4 (emphasis ours): 

In the past 15 years, the number of refineries on the U.S. East Coast has halved to just seven. The closures have reduced the region’s oil processing capacity to just 818,000 barrels per day, down from 1.64 million barrels per day in 2009. Regional oil demand, however, is stronger.

Rory Johnston, a managing director at Toronto-based research firm Price Street and writer of the newsletter Commodity Context, told FreightWaves that refining is a “thankless industry,” with intense regulations that have limited the opening of new refineries. The Great Recession of 2008 led to several East Coast refineries shuttering, but there have been more recent shutdowns too. One major Philadelphia refinery shuttered in 2019 after a giant fire (and it already had declared bankruptcy), and another refinery in Newfoundland shut down in 2020.

2. It’s a financial risk to bring diesel to the Northeast.

The Northeast has increasingly relied on diesel from the Gulf region. Much of that diesel travels to the Northeast through the famous and much-adored Colonial Pipeline. You may remember the 5,500-mile pipeline from last year, when a ransomware attack shuttered it for nearly a week!  

It takes 18 days for oil to travel on the Colonial Pipeline from its source in Houston to New York City (or, more specifically, Linden, New Jersey), Kloza said.

That’s a long enough time to prioritize Colonial pipelines financially risky for traders — or, as Kloza said, “incredibly dangerous” — thanks to a concept called “backwardation.”

Backwardation refers to the market condition in which the spot price of a commodity like diesel is higher than its futures price. It’s only gotten stronger over time in the diesel market, Kloza said. So, a company could send off a shipment of diesel and find that it dropped by $1 per gallon in the time the diesel traveled from the Gulf Coast to New York — er, New Jersey. That could mean hundreds of thousands or more in lost profits, so traders often avoid such a fate.

“We’re not in an era where there are any U.S. refiners or big U.S. oil companies who would ‘take one for the team’ and bring cargo in where it’s needed,” Kloza said. 

The desperation is showing in New England and the mid-Atlantic regions. New England diesel retail prices are up 75% from the beginning of 2022, per DOE data. In the mid-Atlantic, diesel is up 67%. 

It’s not worth the risk, even amid ultra-high prices. As FreightWaves’ Kingston reported last week, the spread between a gallon of diesel in the Gulf Coast and its New York harbor price is usually a few cents. Last week, that swung up to 66 cents.

But that uptick still isn’t justifying moving oil to the Northeast — particularly when traders can make so much more money selling diesel abroad. 

3. Of course, we can blame COVID and the crisis in Ukraine. 

The catalyst for this diesel shortage, of course, is the ongoing conflict in Ukraine — particularly Europe’s desperation for diesel after weaning off Russian molecules. 

As CNBC reported in March, Europe is a net importer of diesel. Europe consumed some 6.8 million barrels of diesel each day in 2019; Russia exported some 600,000 barrels per day of that. Today, Europe has only eliminated one-third of its Russian diesel, so prices are expected to continue to climb amid that transition. Latin America, too, has been clammoring for U.S. diesel.

The Gulf Coast has been happy to provide such diesel, amid “insane” prices for diesel abroad, said Johnston. Waterborne exports of diesel from the U.S. Gulf Coast hit record highs last month, according to oil analytics firm Vortexa. (The records only date back to 2016.)

Naturally, COVID is also to blame for the Northeast’s run on diesel. Those refineries still retained on the East Coast scaled back during the pandemic due to staffing issues. It takes six months to a year to reignite refineries that were previously shuttered, Kloza said.

The ‘everything shortage’ endures

It’s been a tale as old as, well, last year. An industry is quietly hampered by supply issues for years, or even decades, and COVID pulls back the curtains on its unsteady foundation. It’s particularly jarring for commodities we never thought about before, like shipping containers or pallets, but that quietly underpinned our livelihood all along. 

Recall the Great Lumber Shortage of 2020? Big Lumber had unusually low stockpiles of wood by the summer of 2020, thanks to a vicious 2019 in the lumber industry shuttering sawmills and the spring of 2020 sparking staffing issues. (There was also a nasty beetle infestation.) Those in lumber expected the pandemic to slow the economy, not ignite online shopping, construction and housing mania. It meant lumber went from around $350 per thousand board feet pre-pandemic to a crushing $1,515 by the spring of 2021. The lumber price roller coaster persists today.  

In diesel, there’s no beetle infestation, but there are plenty of other headaches. It all means higher fuel prices on the East Coast, particularly the Northeast, to lure molecules from the Gulf Coast. And, down the line, probably more expensive stuff for you. 

Do you work in the trucking industry? Do you want to say that you hate or love MODES? Are you simply wanting to chitchat? Email the author at rpremack@www.freightwaves.com, and don’t forget to subscribe to MODES.

Updated on May 13 with the latest comments from truck stops.

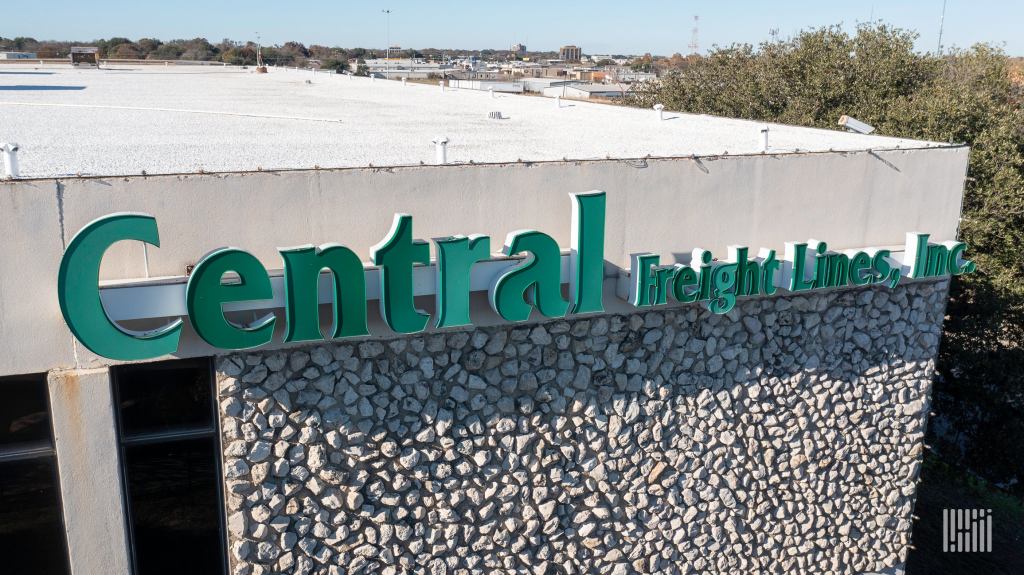
Exclusive: Central Freight Lines to shut down after 96 years

Nearly, 2,100 employees will be laid off right before Christmas. Central Freight Lines is the largest trucking company to close since Celadon ceased operations in 2019.


Waco, Texas-based Central Freight Lines has notified drivers, employees and customers that the less-than-truckload carrier plans to wind down operations on Monday after 96 years, the company’s president told FreightWaves on Saturday.

“It’s just horrible,” said CFL President Bruce Kalem.

A source close to CFL told FreightWaves that CFL had “too much debt and too many unpaid bills” to continue operating, despite exploring all available options to keep its doors open.

Kalem agreed.

“Years of operating losses and struggles for many years sapped our liquidity, and we had no other place to go at this point,” Kalem told FreightWaves. “Nobody is going to make money on this closing, nobody.” 

Central Freight will cease picking up new shipments effective Monday and expects to deliver substantially all freight in its system by Dec. 20, according to a company statement.

A source familiar with the company said he is unsure whether CFL will file Chapter 7 or “liquidate outside of bankruptcy,” but that the LTL carrier has no plans to reorganize.

The company reshuffled its executive team nearly a year ago in an effort to stay afloat, including adding the company’s owner, Jerry Moyes, as CFL’s interim president and chief executive officer. Moyes remained CEO after Kalem was elevated to president in July.

“I think it was surprising that there wasn’t a buyer for the entire company, but buyers were interested in certain pieces but not in the whole thing,” the source, who didn’t want to be identified, told FreightWaves. “Part of it could have been that just the network was so expansive that there was too much overlap with some of the buyers that they didn’t need locations or employees in the places where they already had strong operations.”

Third-party logistics provider GlobalTranz notified its customers that it had removed CFL as “a blanket and CSP carrier option immediately, to prevent any new bookings,” multiple sources told FreightWaves on Saturday.

CFL, which has over 2,100 employees, including 1,325 drivers, and 1,600 power units, is in discussions with “key customers and vendors and expects sufficient liquidity to complete deliveries over the next week in an orderly manner,” a CFL spokesperson said. Approximately 820 employees are based at the company headquarters in Waco.

Despite diligent efforts, CFL “was unable to gain commitments to fund ongoing operations, find a buyer of the entire business or fund a Chapter 11 reorganization,” another source familiar with the company told FreightWaves.

Kalem said the company had 65 terminals prior to its decision to shutter operations. 

FreightWaves received a tip from a source nearly two weeks ago that CFL wasn’t renewing its East Coast terminal leases but was unable to confirm the information with CFL executives. 

Another source told FreightWaves that some of the LTL carrier’s West Coast terminals had been sold recently, but that no reason was given for the transactions.

At that time, Kalem said the company was “working to find alternatives” and couldn’t speak because of nondisclosure agreements. He said executives at CFL, including Moyes, were trying to do everything to “save the company.”

“Jerry [Moyes] pumped a lot of money into the company, but it just wasn’t enough,” Kalem said.

Kalem said he’s aware that a large carrier is interested in hiring many of CFL’s drivers but isn’t able to name names at this point. 

“Central Freight is in negotiations to sell a substantial portion of its equipment,” the company said in a statement. “Additionally, Central Freight is coordinating with other regional LTL carriers to afford its employees opportunities to apply for other LTL jobs in their area.”

As of late Saturday night, Kalem said fuel cards are working and drivers will be paid for freight they’ve hauled for the LTL carrier until all freight is delivered by the Dec. 20 target date.

“I’m going to work feverishly with the time I have left to get these good people jobs — I owe it to them,” Kalem told FreightWaves. “We are going to pay our drivers — that’s why we had to close it like we’re doing now. We are going to deliver all of the freight that’s in our system by next week, and we believe we can do that.”

During the outset of the pandemic, Central Freight Lines was one of four trucking-related companies that received the maximum award of $10 million through the U.S. Small Business Administration’s Paycheck Protection Program (PPP). This occurred around the time that CFL drivers and employees were forced to take pay cuts, a move that didn’t go over well with drivers.

“It all went to payroll,” Kalem said about the PPP funds. “Yes, our employees and drivers did take a pay cut over the past few years, and we gave most of it back, even raised pay over the past several months, but it just wasn’t enough to attract drivers.”

FreightWaves staffers Todd Maiden, Timothy Dooner and JP Hampstead contributed to this report.


Watch: Central Freight Lines’ impact on the LTL market


FreightWaves CEO and founder Craig Fuller reacts to the Central Freight Lines news:

“With Central struggling for many years and unable to reach profitability, it makes sense that they would want to liquidate while equipment and real estate are fetching record prices.”


Central Freight Lines statement

Here is the statement given by Central Freight Lines to FreightWaves late Saturday after reports surfaced of its impending closure:

“We make this announcement with a heavy heart and extreme regret that the Company cannot continue after nearly 100 years in operation. We would like to thank our outstanding workforce for persevering and for professionally completing the wind-down while supporting each other. Additionally, we thank our customers, vendors, equipment providers, and other stakeholders for their loyalty and support.

“The Company explored all available options to keep operations going. However, operating losses sapped all remaining sources of liquidity, and the Company’s liabilities far exceed its assets, all of which are subject to liens in favor of multiple creditors. Despite diligent efforts, the Company was unable to gain commitments to fund ongoing operations, find a buyer of the entire business, or fund a Chapter 11 reorganization. Given its limited remaining resources, the Company concluded that the best alternative was a safe and orderly wind-down. As we complete the wind-down process, our primary goal will be to offer the smoothest possible transition for all stakeholders while maximizing the amount available to apply toward the Company’s obligations.

“Central Freight is in negotiations to sell a substantial portion of its equipment. Additionally, Central Freight is coordinating with other regional LTL carriers to afford its employees opportunities to apply for other LTL jobs in their area. Discussions are ongoing and no purchase of assets or offer of employment is guaranteed.”


Brief history of Central Freight Lines

1925Founded in Waco, Texas, by Woody Callan Sr.
1927Institutes regular routes in Texas between Dallas, Fort Worth and Austin.
1938Dallas facility opens as world’s largest freight facility.
1991Receives 48-state interstate operating authority, expands into Oklahoma.
1993Joins Roadway Regional Group and begins service in Louisiana.
1994Expands into Colorado, Kansas, Missouri, Illinois and Mississippi.
1995Consolidation of Central, Coles, Spartan and Viking Freight Systems into Viking Freight Inc. is announced. Central’s Waco corporate HQ starts closure.
1996Becomes the Southwestern Division of Viking Freight Inc.
1997Investment group led by senior Central management purchases assets of former CFL from Viking Freight and reopens as a new Central Freight Lines.
1999Expands into California and Nevada.
2009CFL Network provides service to Idaho, Utah, Minnesota and Wisconsin.
2013Acquires Circle Delivery of Tennessee.
2014Acquires DTI, a Georgia LTL carrier.
2017Acquires Wilson; new division created with an increase of 80 terminals.
2020Wins Carrier of the Year from GlobalTranz.
Acquires Volunteer Express Inc. of Dresden, Tennessee.
Source: Central Freight Lines

Warehouse cramming is about to begin — Freightonomics

nVision Global, is a leading Global Freight Audit, Supply Chain Management Services company offering enterprise-wide supply chain solutions. With over 4,000 global business “Partners”, nVision Global not only provides prompt, accurate Freight Audit Solutions, but also providing industry-leading Supply Chain Information Management solutions and services necessary to help its clients maximize efficiencies within their supply chain. To learn more, visit www.nvisionglobal.com

Warehouse space is at a premium right now and with peak season right around the corner, shippers are starting to scramble for space. 

Zach Strickland and Anthony Smith look into what shippers are doing to prepare for the end-of-year crunch. They welcome Zac Rogers from Colorado State University to the show to talk through the industry tightness. 

The three also talk about the latest Logistics Managers Index results and what they mean for the fourth quarter of 2021. 

You can find more Freightonomics episodes and recaps for all our live podcasts here.

Seasonality pushing rejections and rates higher ahead of the Fourth

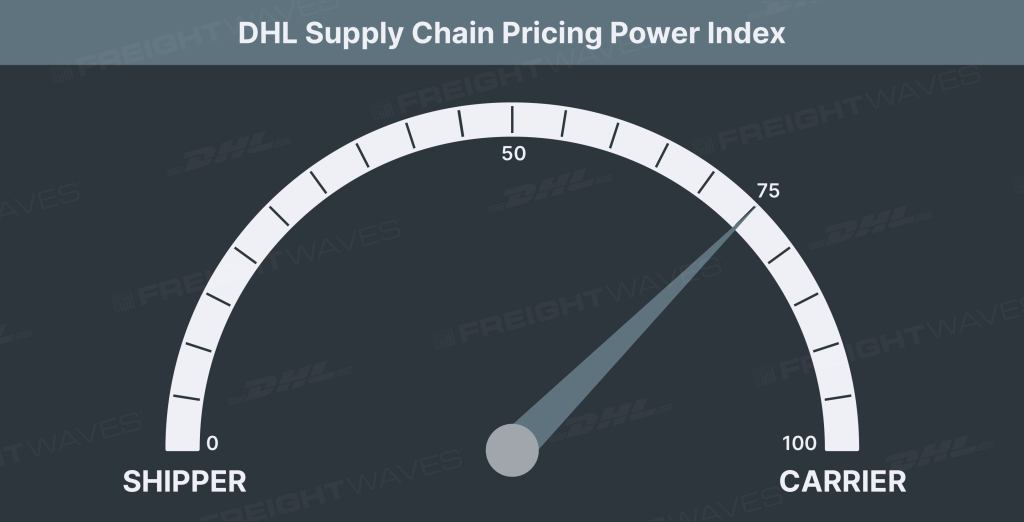
This week’s DHL Supply Chain Pricing Power Index: 75 (Carriers)

Last week’s DHL Supply Chain Pricing Power Index: 70 (Carriers) 

Three-month DHL Supply Chain Pricing Power Index Outlook: 70 (Carriers)

The DHL Supply Chain Pricing Power Index uses the analytics and data in FreightWaves SONAR to analyze the market and estimate the negotiating power for rates between shippers and carriers. 

The Pricing Power Index is based on the following indicators:

Load volumes: Absolute levels positive for carriers, momentum neutral

The Outbound Tender Volume Index at 15,980 is nominally higher now than basically at any point in the past 12 months with the exception of the week prior to Thanksgiving/Black Friday last year. OTVI captures all electronic tenders, including rejected ones, so when accounting for the rejection rate, we can get an even more accurate look at volumes. 

OTVI rose through the back half of May into the national holiday and has risen even further since. Throughout the back half of May and into the middle of June, tender rejections declined substantially. Meaning, current volume throughput is actually understated when comparing OTVI now to OTVI in November 2020. After adjusting for rejected tenders, the accepted outbound tender volume index is just 2.2% below the 2020 peak in November. At that time, OTVI surged towards 17,000, but the rejection rate moved in-kind towards its natural ceiling of 28%. So, the total accepted freight tenders in mid-June is comparable to the peakiest of peak seasons in 2020. Incredible. 

However, since the middle of June, tender rejections have begun increasing again heading into Independence Day, a time when many drivers spend time off the road with their families. The move higher in OTVI this week has been driven primarily by higher rejection rates, rather than higher freight demand. 

Over the past month, the drivers of freight volumes have continued to be imports and from just about every port. The west coast continues to provide seemingly non-stop container ships, while Houston, New Orleans, Miami and Savannah are seeing very strong throughput as well. 

It is van volumes that are driving freight markets higher right now. The Reefer Outbound Tender Volume index has tumbled 25% since its all-time high in the weeks after the polar vortex in February. Since Memorial Day, ROTVI has fallen another 10.5%. This is likely a factor of declining grocery demand, but I would expect the trend to reverse course in the near future as summer festivities accelerate. 

Dry van volumes pushed higher in the back half of May and into June while reefer volumes have declined significantly. 

SONAR: VOTVI.USA (Blue); ROTVI.USA (Green)

The congestion at our nation’s ports has spread from Los Angeles and Long Beach to Oakland, California. The California coastline is a parking lot of container ships, most of which are full to the brim with imports, awaiting berth. As detailed in the economic section, there are some signs that the reversion is underway with Americans paring back spending on pandemic superstar categories in favor of airlines, lodging and entertainment. But spending remains strong despite the moderation, and low inventory levels offset much of the decline that will occur from slowing demand. Real inventories are 3% higher now than pre-pandemic, but real sales growth is far outpacing inventory growth, leading to the lowest inventory-to-sales ratio in decades. 

On the manufacturing side, the ISM Manufacturing PMI expanded in May after declining in April. We’ve been in expansionary territory for 12 consecutive months. New orders, production, imports/exports and employment are all growing. The major issues should come as no surprise: Deliveries are slowing, backlogs are growing and inventories are too low. 

In all, there are many, many catalysts to keep freight demand strong for the foreseeable future. Americans are traveling and spending on services at a high clip, but the high savings rate is enabling it to occur without a massive detriment to goods spending. 

SONAR: OTVI.USA (2021 Blue; 2020 Green; 2019 Orange; 2018  Purple)

Tender rejections: Absolute level and momentum positive for carriers

After declining steadily from mid-March to mid-May, the Outbound Tender Reject Index has reversed course heading into Independence Day. This is typical for a national holiday as carriers selectively choose loads to bring drivers closer to home. OTRI now sits above 25% for the first time in June. 

One of our newest indices in SONAR gives us the ability to compare markets on as close to an apples-to-apples basis as possible. FreightWaves’ Carrier Trend Market Score indices are divided into two perspectives – shipper/broker and carrier. The scores are positioned on a scale from 1-100 and have values measuring van and refrigerated (reefer) capacity. The higher values represent more favorable trends for whichever perspective. For instance, a value near the high-end of the range would suggest very favorable conditions for carriers in our carrier capacity trend score index. 

For the past several weeks, capacity disparities have been driven by import volumes. The markets with the tightest carrier capacity coincide with the nation’s busiest ports. Ontario, California, Savannah, Georgia, and Atlanta all have carrier capacity trend market scores of 100. 

SONAR: Capacity Trend Market Score (Carriers – VAN)

By mode. Reefer rejection rates tumbled from it’s all-time high in March to under 35% in mid-June before popping higher over the past two weeks. Reefer rejections are still quite high from a historical standpoint at 38%, but are significantly lower than just three months ago when reefer carriers were rejecting half of all electronically tendered loads. 

SONAR: VOTRI.USA (Blue); ROTRI.USA (Orange)

Dry van tenders make up the majority of all tenders, so the van rejection rate mirrors the aggregate index closely. Van rejections have surged from ~23% to ~26% over the past two weeks. 

Yes, one-in-four loads being rejected is not ideal, but it’s better than 30%. I am unaware of any meaningful signals that capacity is being added at a rate that would change my outlook. With so many catalysts for demand, and many constraints on drivers including the Drug & Alcohol Clearinghouse, driver training school closures and continued government unemployment benefits, the outlook is tight throughout this year and into 2022. That’s not to say we won’t see improvement as consumers revert to pre-pandemic spending habits and drivers enter or reenter the market. But I’m not expecting any quick reversal of this environment; there are simply too many catalysts driving volume and suppressing capacity. 

SONAR: OTRI.USA (2020/21 Blue; 2020 Green; 2019 Orange)

Freight rates: Absolute level and momentum positive for carriers

Throughout June, spot rates have moderated while contract rates have pushed higher. The Truckstop.com dry van rate per mile (incl. fuel) has fallen from $3.21 to $3.11 since the beginning of June, while FreightWaves van contract rates have risen from $2.50 to $2.59/mile, exclusive of fuel. 

I still believe the Truckstop.com dry van national average will not retest the post-vortex surge pricing that brought spot rates up to an all-time high of $3.30. But, there aren’t many catalysts to bring spot rates down anytime soon either. Demand is unwavering with continued strong consumer goods demand, humming industrial recovery and a potentially cooling, yet still sizzling, hot housing market. And carriers can’t fill enough trucks to keep up with demand. 

Prior to the seasonal movements we’re seeing in tender rejections, routing guides generally had been improving through Q2. We should continue to see a convergence between spot and contract rates, but spot rates will remain historically very elevated throughout the summer as demand simply outstrips capacity. 

SONAR: TSTOPVRPM.USA (Blue); VCRPM1.USA (Green)  

Economic stats: Momentum and absolute level neutral

Several economic releases this week are worth noting.

Weekly jobless claims were released Thursday and give us one of the best close-to-real-time indicators of the overall economy.  This week, the data was again very promising as the labor market continues on a bumpy but trajectorially stable recovery path. 

First-time filings totaled 411,000 for the week ended June 19, a slight decrease from the previous total of 418,000 but worse than the 380,000 Dow Jones estimate, the Labor Department reported Thursday. Initial claims have held above 400,000 for consecutive weeks after falling to a pandemic low of 374,000 three weeks ago. As things stand, the current level of initial claims is about double where it was prior to the Covid-19 pandemic. 

The good news on the jobs front is that continuing claims are on the decline, falling to 3.39 million, a drop of 144,000. That number runs a week behind the headline claims total.

Initial jobless claims (weekly in May 2020-May 2021)

At the time of writing, the newest weekly data for the week ending May 29 had not been updated in SONAR. This week, claims fell from 405,000 to 385,000. 

SONAR: IJC.USA

Consumer. Turning to consumer spending, as measured by Bank of America weekly card (both debit and credit) spending data, total card spending (TCS) in the latest week accelerated to 22% over 2019. This is the first time in June that TCS has topped 20% over 2019, but spending has been running up 16-19% consistently on a two-year comp for months. For contect, the average pre-pandemic two-year growth rate was about 8% (from 2012 to 2019). 

The Bank of America team highlighted service spending in the nation’s two largest state economies, California and New York, which are now fully reopened. Spending at restaurants is now well above 2019 in both states, and the team believes there is more capacity for spending to accelerate in the states that were slower to reopen given pent-up demand. 

There was also a notable acceleration in spending on clothing this week, according to Bank of America. It could be a reversal from some softening in the early weeks of June, or an indication of people refreshing wardrobes ahead of a return to work, more travel and vacations. One tepid statement for freight markets from this week;s report: Leisure spending is on the rise and durable goods spending is flatlining.  

FreightWaves’ Flatbed Outbound Tender Reject Index, both a measure of relative demand and capacity, moves directionally with the ISM PMI. 

SONAR: ISM.PMI (Blue); FOTRI.USA (Green) 

Manufacturing. Over the past two weeks, regional manufacturing surveys have reported generally positive readings amid logistical challenges. The New York Fed’s Empire State business conditions index declined 6.9 points to 17.4 in June, retreating from strong readings the past two months. The Empire State Index is a diffusion index with a baseline of zero; any reading above zero indicates improving or expansionary conditions. 

Delivery times lengthened to a new record during the month, new orders and shipments fell, and inventories entered negative territory. The supply chain and transportation challenges are as visible upstream as downstream, but overall the manufacturing sector is handling. Growth continued throughout the second quarter in both the Empire State and Philly Fed indices. 

The Philadelphia Federal Reserve’s business activity index edged lower to a still robust 30.7 in June from 31.5 in the prior month. Unlike NY, the pace of shipments growth accelerated in the Philly region during June. The employment subcomponent rose to a very healthy 30.7 from 19.3 last month, the regional bank said. 

Record-long lead times, wide-scale shortages of critical basic materials, rising commodities prices and difficulties in transporting products are continuing to affect all segments of the manufacturing economy, but demand remains strong. 

For more information on the FreightWaves Freight Intel Group, please contact Kevin Hill at khill@www.freightwaves.com or Andrew Cox at acox@www.freightwaves.com.

Check out the newest episodes of our podcast, Great Quarter, Guys, here.

Project44 acquires ClearMetal to strengthen predictive tools

Project44, a leader in real-time visibility of the global supply chain, announced on Thursday it has acquired ClearMetal, a San Francisco-based supply chain planning software company that focuses on international freight visibility, predictive planning and overall customer experience. The terms of the acquisition were not disclosed.

ClearMetal, founded by top software engineers and data scientists from Stanford, Google and other Silicon Valley elites, has created a “continuous delivery experience” that leverages proprietary machine learning algorithms that can forecast supply chain disruptions. 

In an interview, Jason Duboe, chief growth officer at project44, explained that bringing in ClearMetal’s elite team is essential for the company’s future predictive solutions.

“Their team construct is fundamentally different. When you look at their data science, machine learning and computer science background, they are best in class,” he said. “Applying the team to solve really interesting challenges, starting with highly predictive ETA and deeper exception management to create more predictive analytics is really a key component here.”

Project44 recently acquired Ocean Insights to gain global supply chain vessel visibility and has announced it has expanded its truckload tracking services within Asia. Bringing on this new team of engineers will allow the company to capitalize on strong predictive tools, strengthening the supply chain of its customers.

“We’re going to be expanding deeper into Asia, and from a port perspective, getting data much earlier than competitors,” explained Duboe. “Our freight forwarder integrations will give us much deeper visibility from an end-to-end perspective in these regions.”

Along with the acquired skills the ClearMetal team will bring to project44, it brings a large book of customers, including large CPGs, retailers, manufacturers, distributors and chemical companies. These advanced use cases will strengthen the predictive planning tools, and project44 continues to expand into different customer markets.

“What we gain from ClearMetal is a holistic platform for anybody that joins the platform in the future,” said Duboe. “They have large customers with incredibly demanding and advanced use cases. So when it comes to order and inventory, functionality, supplier onboarding, and moving upstream into those processes, we can capture exceptions earlier on.”

Click here for more articles by Grace Sharkey.

Related Articles:

Project44 expands real-time visibility into China

Project44 reels in Ocean Insights in ‘largest acquisition in visibility space’

‘Project44’s vision has always been global’

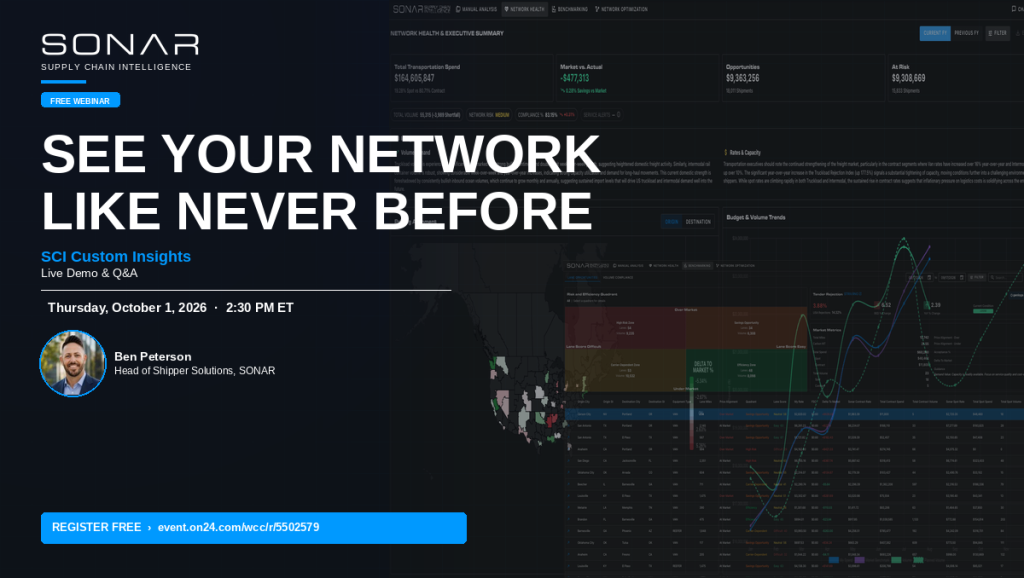
SONAR Launches SCI Custom Insights — Free Webinar Demo October 1

See how leading shippers are using their own freight data to find where they’re overpaying, where service risk is building, and where they can save — live and in real time.

Shippers have spent years being told to let the data drive decisions. The harder problem has always been getting the right data, in the right context, fast enough to actually act on it.

SONAR’s new SCI: Custom Insights is designed to close that gap — and on Thursday, October 1st at 2:30 PM ET, SONAR is hosting a free live demo so shippers can see exactly how it works.

Register free here.

What SCI: Custom Insights Does

SCI: Custom Insights is a new capability within SONAR’s Supply Chain Intelligence platform, available to members of the SONAR Shipper Consortium. Participating shippers contribute their own transportation data — tendered volume, accepted and rejected tenders, carrier information, rates and lane activity — and SONAR layers it against its real-time market benchmarks to produce an ongoing, actionable view of network performance.

The result is a platform that helps shippers answer the questions that typically require weeks of manual analysis: Where are we paying above market? Which lanes are creating service risk? Are carriers performing the way we expected? Where should we focus first?

The platform is organized across three core areas.

Network Health provides an executive-level summary of the entire transportation network — total spend, market vs. actual rate performance, savings opportunities, at-risk freight, tender compliance, and budget vs. volume trends — all in one place. AI-driven insights surface shifts in volume demand, rates, and capacity so teams know where to direct attention before issues compound.

Benchmarking takes the analysis lane by lane. The Lane Opportunities module classifies every lane into one of four categories — High Risk, Savings Opportunity, Carrier-Dependent, or Efficiency Zone — based on pricing alignment, lane difficulty, and market conditions. Volume Compliance then maps planned vs. actual freight movement, giving procurement and operations teams the context they need to have productive conversations with carriers about performance and pricing.

Network Optimization goes deeper into the markets and carriers driving results. Network Analysis groups performance by origin or destination market, making it straightforward to identify whether an issue is isolated or part of a broader trend. Carrier Intelligence provides a network-wide view of carrier performance — average rates, rate variance, acceptance rates, rejected volume, lanes, haul length, and risk level — with AI-generated guidance on where to reallocate freight or renegotiate.

SCI: Custom Insights does not replace the existing Manual Analysis workflow in SONAR SCI. That capability remains available for mini-bids, project freight, scenario planning and new lanes — giving participating shippers both an ongoing view of their existing network and the flexibility to run one-off analysis when needed.

Why This Matters Right Now

Freight markets are tightening. Bid season is approaching. Capacity conditions are shifting faster than most routing guides were designed to handle.

For shippers managing complex networks across dozens of markets and carriers, the difference between knowing where performance is slipping and not knowing can be measured in millions of dollars. Most shippers don’t discover they’ve been overpaying until a bid cycle forces the comparison. SCI: Custom Insights is built to surface that information continuously — not once a year.

Join the Live Demo — October 1st

Ben Peterson, Head of Shipper Solutions at SONAR, will walk through the full platform live on October 1st and take questions in real time. The session is free and open to both current SONAR customers and shippers evaluating their options heading into bid season.

Here’s what attendees will see:

  • A live walkthrough of the Network Health executive dashboard
  • Lane-level benchmarking and the Risk & Efficiency Quadrant in action
  • Carrier Intelligence — how to identify which carriers to evaluate and where to shift volume
  • Network Analysis by origin and destination market
  • How Custom Insights and Manual Analysis work together

📅 Thursday, October 1, 2026
🕑 2:30 PM ET
💻 Free — virtual

Reserve your seat here.

SCI: Custom Insights is available exclusively to members of the SONAR Shipper Consortium. Shippers interested in learning more about consortium membership can reach out to sci@gosonar.com. If you’d like a personalized demo of SONAR’s SCI product, request it here.

Rail freight slides in rare off-week

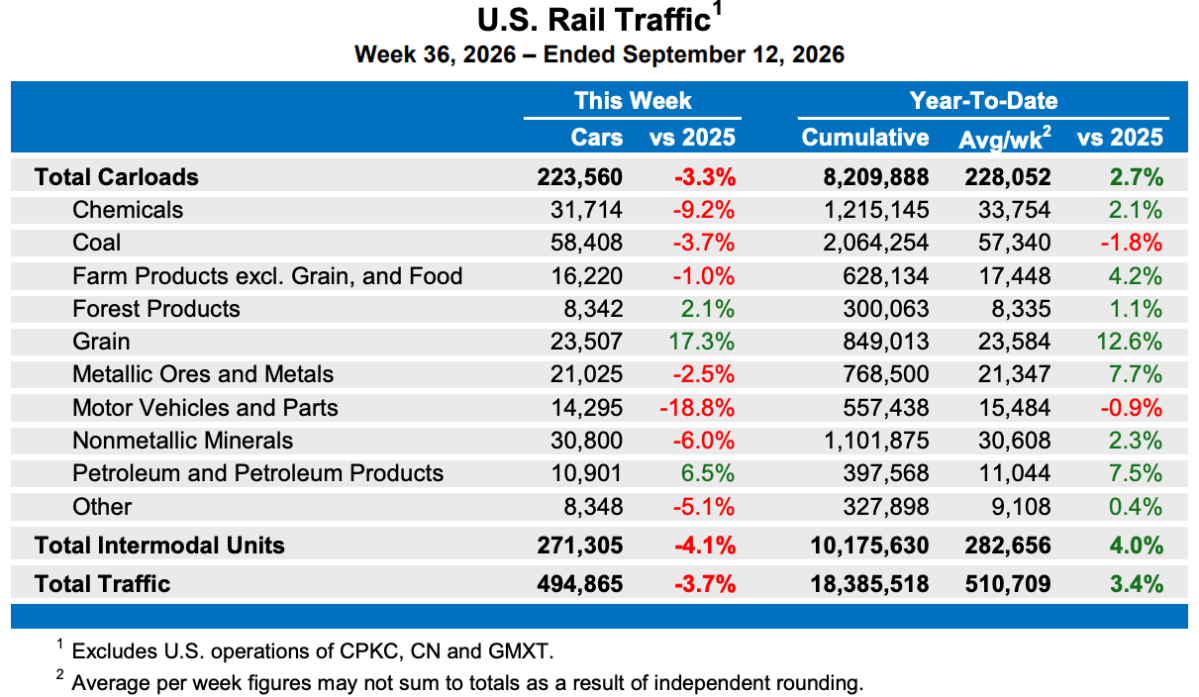
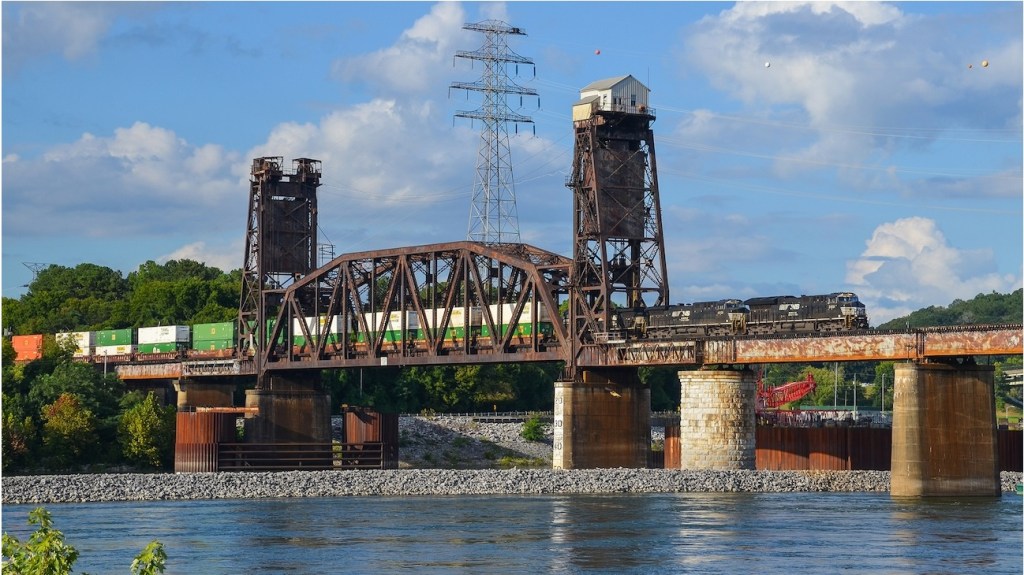
Weekly rail traffic on U.S. railroads totaled 494,865 carloads and intermodal units for the week ending Sept. 12, down 3.7% from the same week a year ago.

Commodity freight came to 223,560 carloads, the Association of American Railroads reported, off 3.3%, while intermodal volume of 271,305 containers and trailers was weaker by 4.1%, y/y.

Just three of 10 carload commodity groups improved: Grain, 17.3%; petroleum and petroleum products, 6.5%; and forest products, 2.1%.

Motor vehicles and parts led decliners, down 18.8%, followed by chemicals, 9.2%, and nonmetallic minerals, 6%.

For the first 36 weeks of 2026, U.S. railroads reported cumulative volume of 8,209,888 carloads, better by 2.7%, and 10,175,630 intermodal units were up by 4% y/y. Total traffic of 18,385,518 carloads and intermodal units improved by 3.4% from a year ago.

(Chart: AAR)

North American volume for the week on nine reporting U.S., Canadian and Mexican railroads totaled 326,500 carloads, down 3.3%, and 353,081 intermodal units, off 3.8%, from 2025. Total combined traffic reached 679,581 carloads and intermodal units, a decrease of 3.6%. North American volume for the first 36 weeks of this year was 25,216,803 carloads and intermodal units, a gain of 3% y/y.

Subscribe to FreightWaves’ Rail e-newsletter and get the latest insights on rail freight right in your inbox.

Read more articles by Stuart Chirls here.

Read more:

Norfolk Southern: New intermodal era about removing rail friction

Container delays by rail increase at busiest U.S. ports

U.S. container imports climb 3.8% to 2.6 million TEUs, 3rd highest monthly level

Houthi gains deepen risk as carriers restore Red Sea services

Almost 1 million TEUs in new record for this U.S. container gateway

Freight Procurement Is Always On Now — AI Speeds It Up

AI in freight procurement could cut bid events from months to just 2-3 weeks. Emerge CEO Mark McEntire explains why shippers can’t treat procurement as a once-a-year event anymore. In this FreightWaves Today interview, McEntire breaks down the shift from annual RFPs to continuous procurement, why price alone is no longer enough, and how shippers are weighing capacity, carrier fit, risk and fraud in a tighter market. If you manage transportation procurement, routing guides or carrier strategy, this one gets straight to the point.

Emerge has installed a new CEO with more than three decades of experience on the shipper side of freight, signaling a strategic pivot toward closer customer alignment and product development rooted in operational reality. The executive, who previously held a role at Emerge before returning, said he reintroduced himself to the organization roughly two weeks before the interview, describing himself as being on “day 15” with what he called “day one energy.”

The most urgent message he brought to the role: the traditional annual freight procurement cycle is broken. “Procurement always needs to be on,” he said. “You can’t just set it and forget it.” He described a market evolution he has watched firsthand, from shippers running a single annual RFP to two per year, then quarterly events, then continuous mini-bids — a trend he said technology is now accelerating further.

“I don’t think price alone is enough anymore. If you get a rate in a bid, but it doesn’t come with reliable capacity, it isn’t really a rate.”

Beyond rate, he argued that carrier fit, lane fit, performance, and fraud risk must now be embedded in procurement platforms. He said Emerge helps shippers vet those factors, calling the outcome more resilient than traditional cost-and-service evaluations. Risk and fraud, he noted, are being introduced into the procurement process in ways that were not common even a few years ago.

On artificial intelligence, he drew a practical line between signal and noise: if AI helps make a better decision, eliminates waste, or eliminates work, it is valuable; if not, it is noise. He said AI’s most concrete near-term impact in procurement is speed — compressing a bid event that can take two months just to gather data down to a two-to-three-week process. “Shippers sit on a mountain of data,” he said. “It’s impossible for a human to see all the patterns in that data, the anomalies with the rates, the routing guide deterioration.” He stopped short of predicting AI would replace procurement professionals, but said it would deliver demonstrably better outcomes.

Emerge recently added LTL procurement capability through ProcureOS, bringing truckload, LTL, intermodal, and rail procurement under a single platform. The CEO said shippers do not view their networks in silos and that consolidating those modes under “one pane of glass” is central to the company’s growth thesis. He declined to detail what comes next on the product roadmap, saying the team would stay close to customers to identify gaps.

He outlined three priorities for his first year: getting company leaders talking to customers every day, driving growth through both new logos and expanded wallet share with existing accounts, and instilling organizational urgency. He also pointed to a 16-member customer advisory board created during his previous tenure at Emerge as a key mechanism for distilling customer feedback into product decisions, noting that the strategic account management team he built then remains in place.

  • Emerge’s new CEO says AI can shrink a freight bid cycle from roughly two months to two to three weeks by automating data gathering and pattern recognition.
  • He argues procurement must move from an annual ‘set it and forget it’ event to a continuous process, with carrier capacity reliability now as important as price.
  • Emerge has added LTL procurement via ProcureOS, putting truckload, LTL, intermodal, and rail sourcing on a single platform.

This Summary is generated thanks to a transcription of the interview, for the full interview please enjoy the video above.

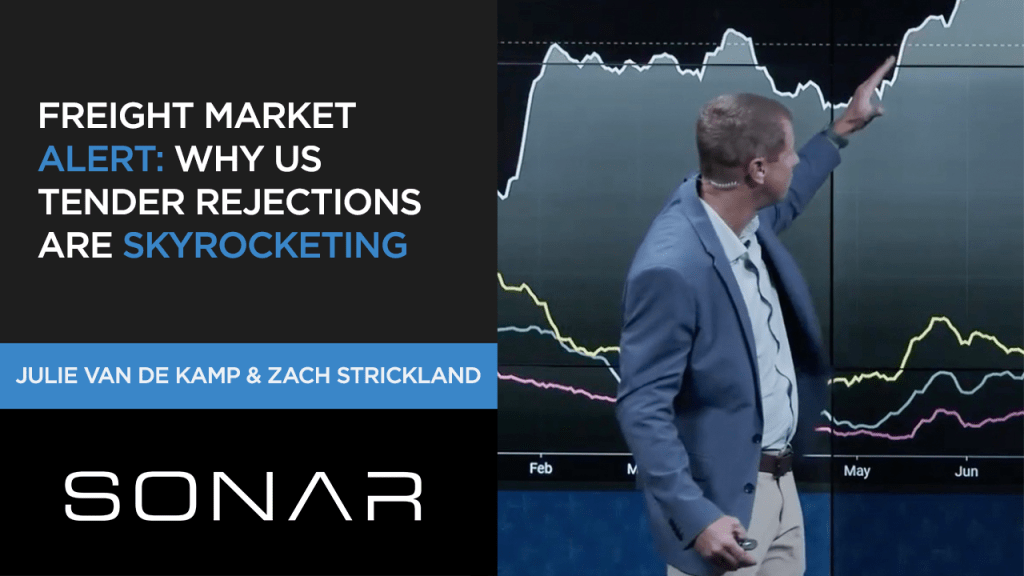
Freight Market Alert: Why US Tender Rejections Are Skyrocketing

The freight market is showing an unusual tightening with widespread increases in tender rejection rates across the United States. Join us as we dive into the latest SONAR data, analyzing the unexpected post-Labor Day surge and what it signals for capacity and spot rates. We’ll examine regional impacts, trailer type trends, and the underlying factors driving this shift. Understanding these nuances is critical for shippers and carriers navigating a fragile market.

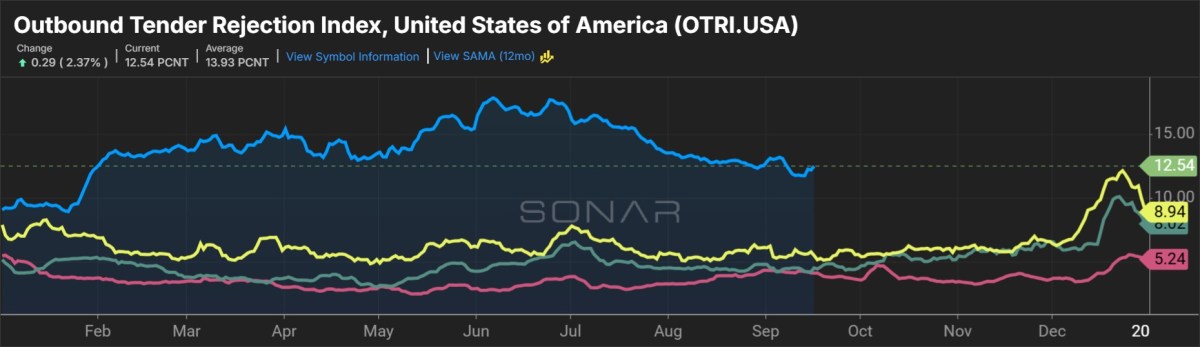
The national Outbound Tender Rejection Index climbed to 14.32% in the days following Labor Day, a move that FreightWaves analyst Zach Strickland says is unusual enough to warrant close attention from carriers, brokers, and shippers alike. Unlike typical seasonal spikes tied to tropical weather or road-check weeks, this increase is showing up across virtually every major freight market in the country.

“I think one of the things that Craig and I talk about all the time is how fragile the market is,” said Strickland. “Capacity still has not grown in any meaningful way. Capacity itself is a very slow figure to change over time. It takes long stretches of time, hence the 3-year downturn that we had with the rejection rates all below 5%.”

“This is very unusual. This is not seasonal. It’s a nuance in the market. You’ve got to watch it.”— Zach Strickland

A sharp post-holiday volume surge is a primary driver. Strickland described the Labor Day shipping pattern as “probably the most aggressive post-holiday shipping surge” seen throughout the year, as shippers who deferred freight decisions ahead of the holiday returned to their desks and released a concentrated burst of tender activity. FreightWaves’ Sonar demand data showed a steep spike out of the Labor Day trough, standing well above levels recorded at the same point in 2025.

The Weighted Rejection Index — which combines weekly changes in tender rejection rates with market share to weight larger freight markets more heavily — showed widespread blue across the map, indicating deteriorating carrier acceptance. Notably, major freight hubs including Dallas, Chicago, Atlanta, and Harrisburg all registered increases, meaning the move is not being driven by a single tight regional market. Strickland also flagged Twin Falls, Idaho, a produce-heavy refrigerated corridor, along with harvest-season activity building in Iowa and the Dakotas as contributing factors.

By trailer type, refrigerated rejections are rising in line with seasonal expectations, as fall harvest demand pushes reefer capacity tighter — a pattern Van de Kamp noted tends to produce some of the highest refrigerated rejection rates of the year. Flatbed rejections have edged higher but remain subdued, weighed down by weak housing starts and uncertainty around CHIPS Act-related construction spending. Dry van rejections are the focal point of the current move.

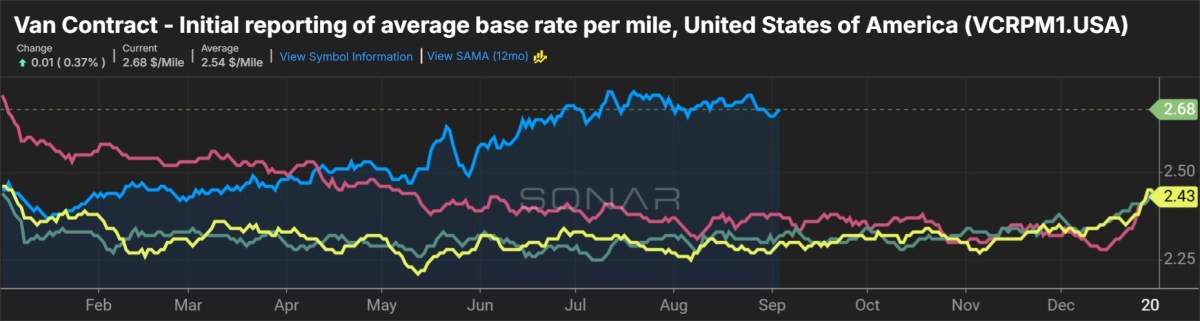
Spot rates are beginning to reflect the tightening. Strickland noted that tender rejection rates historically lead spot rate movements and warned shippers not to expect the typical post-Labor Day rate rollover. “Watch out on the spot market here,” he said. “We’re already starting to see a little bit of a notch up.” One structural factor keeping the market sensitive to demand swings: Atlantic hurricane season has so far produced no storms, removing what is typically a September wildcard for capacity disruption along the Southeast corridor.

With end-of-quarter shipping activity still ahead and consumer demand trends around the holidays uncertain, Strickland said the market has considerable runway before conditions clarify. For now, the breadth of the rejection rate move — rather than its magnitude — is the signal carriers and shippers should be tracking.

  • National tender rejections reached 14.32% following Labor Day, driven by a broad-based volume surge rather than a single regional disruption.
  • The Weighted Rejection Index shows deteriorating carrier acceptance across major hubs including Dallas, Chicago, Atlanta, and Harrisburg, with refrigerated rejections rising seasonally on fall harvest demand.
  • Tender rejection rates are leading spot rates higher, and analysts warn shippers not to expect the typical post-Labor Day rate decline.

This Summary is generated thanks to a transcription of the interview, for the full interview please enjoy the video above.

USMCA Deadlock, Canada Bans: What It Means for Trucking

Canada tariffs are now hitting 700+ U.S. products, and some trade flows are moving from tariffs to outright bans. Kyle Peacock of Peacock Tariff Consulting breaks down what the U.S.-Canada breakdown and USMCA deadlock with Mexico mean for cross-border freight, trucking lanes, auto, steel, aluminum and shipper planning. The big takeaway: freight is already being pulled forward, lanes are shifting, and long-term decisions are getting harder. #CrossBorderFreight #Tariffs #USMCA

Canada has slapped tariffs of up to 50% on more than 700 American products and moved beyond tariff retaliation to outright import bans on select goods — including motorcycles and certain dairy products — marking a sharp escalation in the U.S.-Canada trade standoff. Meanwhile, a fourth round of U.S.-Mexico USMCA renegotiation talks wrapped in Washington this week without resolution, deadlocked over auto-content thresholds that Mexican officials say are unworkable within the proposed timeline.

The practical fallout for freight is already visible. Canadian manufacturers facing bans are pulling shipments forward to beat deadlines, driving short-term volume spikes that will leave carriers with empty lanes once the bans take effect. On the U.S. side, motorcycle dealers are placing early orders to avoid inventory shortfalls. “The trade routes will change and/or disappear based on these bans,” said Kyle Peacock, principal at Peacock Tariff Consulting.

“Tariff rates [are] driving the trucking lanes to a different geographical area — north, the northern borders, and the south and southern borders between Mexico and the U.S. as well. We’re seeing less freight crossing, and it’s based on these additional tariffs.” — Kyle Peacock, Peacock Tariff Consulting

The most immediate shift in freight geography is north-south lanes giving way to east-west corridors inside Canada. Peacock noted that traditional cross-border hauls between the northern U.S. states and southern Canada are shrinking, while intra-Canadian east-west moves are growing. Carriers that built networks around U.S.-Canada backhaul loops are losing the return legs, reducing asset utilization across legacy supply chains. Sectors feeling it first, Peacock said, are metals, aluminum, and automotive — industries built on just-in-time replenishment that leaves little buffer against tariff-driven disruptions.

Mexico faces a different pressure. The Mexican government initially aligned with U.S. policy by adding its own tariffs on Chinese goods, expecting relief from American levies in return. That concession has not produced a reprieve. Peacock said Mexico has essentially walked away from the auto-content negotiation, arguing that hitting the thresholds Washington is demanding “just doesn’t work in the timeframe that they’re giving.” The next scheduled round of U.S.-Mexico talks is set for the end of September in Washington. USMCA is subject to annual review through 2036, creating a decade of potential policy swings that shippers and carriers must now plan around.

For businesses caught in what Peacock called “decision paralysis,” his firm’s advice is to lock in capacity now. Spot-rate strategies that worked in calmer markets are giving way to dedicated long-term contracts as both shippers and carriers seek cost certainty. “For those that would have lived on the spot rate for years, now it’s okay, let’s get a dedicated rate for this customer, for this client, and ingrained in the long term,” Peacock said. Manufacturers considering new production lines or facilities in the U.S., Canada, or Mexico are largely in a wait-and-see posture, which Peacock warned is itself costly given the infrastructure investment needed.

Looking ahead, Peacock drew on precedent from other trade disputes, saying tariffs historically “go up in the elevator and take the stairs down.” He does not expect a swift return to tariff-free USMCA conditions, predicting that a new trilateral agreement signed by all three parties would be required to fully reset terms. He placed Canada as the more likely near-term deal, citing the progress made by U.S. Trade Representative Jameson Greer and Canadian Minister Dominic LeBlanc before talks broke down, while flagging significant additional U.S.-Canada tariffs scheduled to take effect January 1 as a hard deadline that could force movement.

  • Canada has imposed tariffs up to 50% on 700-plus U.S. products and added import bans on goods including motorcycles and dairy, prompting Canadian manufacturers to rush shipments before deadlines.
  • North-south cross-border freight lanes between the U.S. and Canada are shrinking as trade shifts to east-west Canadian corridors, disrupting legacy carrier networks and reducing asset utilization.
  • With USMCA subject to annual review through 2036 and U.S.-Mexico auto talks deadlocked, Peacock Tariff Consulting advises shippers and carriers to abandon spot-rate strategies and lock in long-term dedicated contracts now.

This Summary is generated thanks to a transcription of the interview, for the full interview please enjoy the video above.

How This Freight Cycle Could Last

Freight’s cycle-ending forces are still stacking up, but Reliance Partners’ Chief Revenue Officer Thom Albrecht sat down with us to discuss why this one might last.

Nearly 360 trucking, freight brokerage, and insurance professionals packed the Grand Hyatt Nashville for the 5th Annual Trucking Matters Seminar Series, Reliance Partners’ largest turnout yet for an event that started with 160 attendees in its first year. Over two days, the agenda moved from federal safety policy to cargo theft, credit risk, and the future of freight brokerage. The event opened, as it has in years past, with Albrecht’s signature freight, capacity, and economic update.

Albrecht split his presentation into two parts. The first was a traditional read on the health of the consumer and businesses, along with the broader economy. The second, framed as “a tale of two cities,” dug into the structural overhaul reshaping trucking capacity and why he believes the industry may be entering a freight cycle unlike any in the past two decades.

The economic data paints a mixed picture. Inflation-adjusted wages had strung together 35 straight months of gains after a brutal 25-month stretch of declines until April and May of this year turned negative again. Consumers are still climbing out of a purchasing-power hole.

Category-level inflation is an even messier story than the approximately 3.5% headline CPI figure suggests. As of the 5th Annual Trucking Matter Seminar, Gasoline was up 26.7% year over year even as it fell nearly 10% in June alone; lettuce and tomatoes were up 23.8%; coffee climbed 18.5%. Meanwhile, bacon, used vehicles, and eggs were all down on a year-over-year basis. Savings rates, sitting near 3% against a historical average north of 8%, left little cushion. Credit card delinquencies at 90 days had climbed back to 7.1%, still shy of the Great Financial Crisis peak but well above the lows of early 2022.

Business demand, Albrecht noted, was not robust, but better than in 2025. Customer inventories remained near survey-history lows. That’s good news for freight creation as this year’s replenishment freight has been steadier than a year ago. AI-related capital spending, meanwhile, accounted for nearly 70% of first half 2026 GDP growth. Strip out AI, tech, and government spending, and the rest of the economy actually contracted slightly in Q1 and barely grew in Q2.

Housing has been “stuck” for nearly four years. Existing home sales per 1,000 households had fallen to roughly 26, well below the 44-59 range of the 2000s and 2010s, with affordability consuming an estimated 43% of household disposable income against a more affordable level around 30%.

“A Tale of Two Cities,” a reference to the Dickens line “It was the best of times, it was the worst of times,” set the tone for the conference. Fraudulent and non-compliant carriers, Albrecht argued, had been thriving for years while compliant fleets absorbed the cost of doing things the right way. 

His data backed it up: compliant carriers operate at roughly $2.38 a mile once insurance, payroll, drug testing, legal CDLs, and maintained equipment are factored in, versus roughly $1.65 a mile for carriers who cut those corners. That means a non-compliant 50-truck motor carrier has up to a $6.5 million cost advantage compared to a compliant 50-truck fleet.

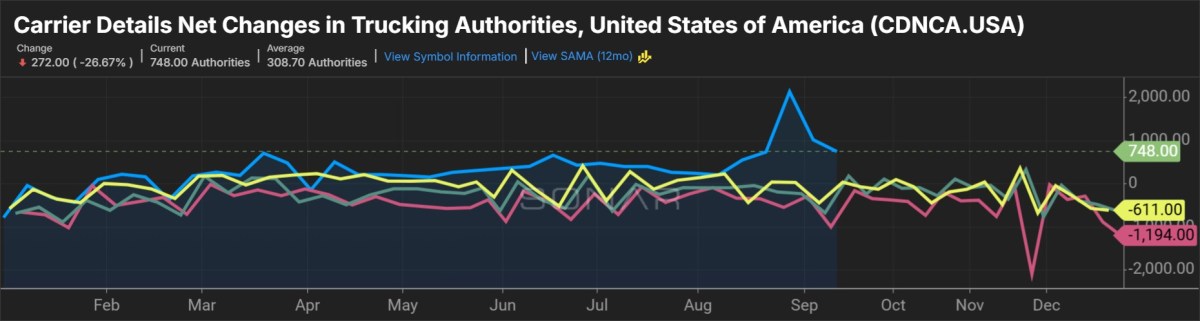
Newly registered DOT numbers for for-hire, interstate, general freight carriers had exploded from a 2010-2019 yearly average of 9,760 to a 2020-2025 average of 36,658, with nearly 60,000 new registrations in 2025 alone. Albrecht’s presentation flagged the telltale signs of the fraud driving those numbers. Carrier phone numbers like 123-456-7890 and 867-5309, single addresses housing hundreds of “trucking companies,” and CDL mills with advertisements in various languages are all recognizable patterns.

Albrecht highlighted that there are still CDL schools advertising obtaining a CDL without English proficiency. Even today, there are several real examples visible online.

Albrecht’s Thoughts on the Potential of a Trucking “Super Cycle”

During the motor carrier panel discussion, Albrecht made the case that this cycle could break from trends in recent history. Freight cycles are typically defined as sustained stretches of rising rates followed by contraction. Albrecht defines a super cycle as one that runs longer than two years and one in which pricing is much stronger than CPI, if not double-digit. The industry hasn’t cleared that threshold since the cycle that lasted from mid-2003 to the fall of 2006.

The 2013-2014 and 2017-2018 cycles both petered out after roughly 18 months, and each was tied to a single regulatory catalyst (an Hours of Service change in the former, the ELD mandate in the latter). And even the recovery after the housing collapse lasted less than 20 months, albeit without any trucking regulatory changes.

This cycle has the potential to be different, Albrecht argued, because it isn’t riding on one rule change. He also acknowledged the danger in stating that “This time is different” given the history of failed proclamations throughout history.  “Thus far there have been a handful of regulatory changes during this cycle , and more changes are expected, both as new regulations and also to tighten enforcement of existing regulations where ‘loopholes’ have been exploited.  I look for more than a handful of NPRMs in the next couple of quarters,” Albrecht said.  NPRMs are Notices of Proposed Rulemakings from the FMCSA.

Changes that have already impacted the market include English Language Proficiency enforcement, non-domiciled CDL restrictions, and cabotage rules already in effect, with a proficiency exam for new-entrant motor carriers advancing through the rulemaking pipeline. FMCSA signaled on July 27 that it is moving forward on new entrant proficiency exam rulemaking. The FMCSA also announced the elimination of self-certification of CDL entities and ELDs.  While nearly 8,000 CDL entities have been removed from the system, thousands more could also be removed.  In 2019, according to Albrecht, there were approximately 6,000 entities in the TPR (training provider registry) and on November 30, 2025 there were 39,554 and today that number is still above 30,000.

In terms of ELDs, “simply announcing that third party certification will be required is insufficient”, Albrecht said, “and I expect more details later this year or early in 2027 around what the certification process will look like.  With approximately 1,000 ELDs in the United States, compared to just 41 in Canada, I believe that once third party certification is in place, that there could eventually be barely 30 approved ELDs in the U.S.”

“Also, when I think about the new entrant spigot, a written exam to show proficiency around hours of service, hazmat driving, what to do in the event of a crash, selected maintenance issues, and other topics, would be an improvement over simply applying for and receiving a DOT number,” Albrecht said.

“Aside from raising the price to obtain a DOT number and requiring more thorough verification of the identity of the new carrier, including authenticating the principal place of business, ownership, multiple DOT and MC numbers, etc.,” Albrecht said, “written exams would demonstrate some start-up knowledge that would obviously need to be accompanied by an onsite audit around the 1-year anniversary of a new motor carrier.”

“However, for a true super-cycle to occur, more needs to be done. If the FMCSA were to stop pursuing changes today, the cycle would be over by late 2027 or early 2028, meaning it would be like all the cycles since the last super cycle over 20 years ago,” Albrecht said. “More needs to be done. Right now, we’re in a boat with numerous holes. We have to plug those holes to improve safety and compliance and to ensure a cycle that lasts more than two years.”

What shippers and carriers are watching

The conference’s motor carrier and shipper panels reinforced the numbers with on-the-ground sentiment. Fleet leaders from Christenson Transportation, Apex Transit Solutions, Crossett Inc., CB Freight, and Excel Trucking described a freight market that’s currently healthy but historically prone to losing steam after 18 to 20 months. The consensus is that this time, structural capacity losses may be permanent.

Shippers on the panel, including representatives from General Mills, Shaw Industries, Simmons Foods, Armada Supply Chain Solutions, and KBX Logistics, said service levels have deteriorated and several are actively rebuilding relationships with small and mid-sized carriers after leaning too hard into mega-carrier capacity. Many expect the gap between spot and contract rates to close by early 2027 and are bracing for double-digit rate increases, even if no one on stage would commit to a number.

The event’s newest addition was a live Q&A with FMCSA Deputy Administrator Jesse Elison, and it gave attendees direct access to the agency shaping that regulatory pipeline, fielding questions on enforcement priorities and the road ahead for commercial motor vehicle safety policy. A new freight brokerage panel on the fallout from the Montgomery Supreme Court ruling, featuring leaders from Backhaul Direct, FreightVana, Steam Logistics, and Axle Logistics, tackled the murkier legal terrain brokers are now navigating. Litigation panelists from The Sloan Firm and Scopelitis, Garvin, Light, Hanson & Feary noted that with the finer points of “safe carrier” case law still undecided, plaintiff attorneys have little incentive to leave freight brokers out of discovery.

Reliance Partners has now brought shipper representatives to Trucking Matters for three consecutive years, which sets the event apart from other industry gatherings that are built primarily around carriers and brokers.

The 6th Annual Trucking Matters Seminar Series is set for July 14-15, 2027, back at the Grand Hyatt Nashville.

Learn more at reliancepartners.com.

CMT launches safety platform for freight brokers

Cambridge Mobile Telematics (CMT) has expanded its road safety platform into the freight industry, giving brokers access to recent driving data from participating carriers.

On Sept. 2, the company announced the launch of Freight Safety Intelligence, which analyzes driving behavior from the previous 90 days and generates a carrier-level safety score. CMT said the score is designed to give brokers another way to evaluate carriers before booking freight, while allowing participating carriers to demonstrate recent safety performance.

The platform uses data from carriers’ existing telematics systems rather than requiring them to install new hardware, according to CMT. Carriers have the choice to opt in to the program and they control what specific information they share.

CMT said its analysis of the previous 90 days of driving is used to generate a safety score that has been validated against actual accident risk. The company did not disclose details of the validation methodology in its announcement.

“With CMT’s Freight Safety Intelligence, we can see real safety insights for every carrier before we book, identify the safest carriers, and open more doors for them,” said Brad Bergstrom, CEO of B4 Logistics.

The launch also comes after a recent Supreme Court ruling involving broker responsibility for carrier selection. In May, the court ruled in Montgomery v. Caribe Transport II, LLC that a lawsuit alleging a broker negligently selected a motor carrier could move forward under state law. The case involved C.H. Robinson and a crash in Illinois. The ruling does not require brokers to use a specific screening system, but it leaves brokers open to negligent-selection claims tied to carrier safety.

The ruling puts additional focus on the information brokers use when deciding which carriers to book, which is especially important as large trucks are involved in thousands of crashes per year. 

In 2024, 5,218 large trucks were involved in crashes that resulted in a fatality in the U.S., according to the National Safety Council. That was down 3% from 2023 but up 30% from 2014. 

CMT said traditional safety records do not always provide brokers with a current picture of how a carrier is driving.

“Freight brokers need a more current, data-driven view of carrier safety,” said William V. Powers, CEO of CMT. “Freight Safety Intelligence gives freight brokers the most current view of driving safety of the carriers they book.”

The company cited Federal Motor Carrier Safety Administration (FMCSA) data showing that about 94 percent of interstate freight carriers eligible for a federal safety rating did not have one in 2021.

The absence of a federal safety rating does not mean a carrier has been determined to be unsafe. FMCSA safety ratings are issued following certain compliance reviews and can be classified as satisfactory, conditional or unsatisfactory.

Freight brokers already use information such as FMCSA records, insurance status, operating history and other carrier data when evaluating whether to book a shipment. CMT’s platform adds recent driving behavior to those existing sources of information.

Freight Safety Intelligence expands CMT’s existing work with commercial fleets. The company launched its DriveWell Fleet platform earlier this year to provide telematics-based safety information to commercial fleets and insurers.

Why this matters: 

Brokers rely on safety records, insurance information, operating history and other data when deciding which carriers to book, but some of that information may not reflect a carrier’s most recent driving behavior. CMT’s platform adds recent telematics data to the carrier-selection process, giving brokers another source of information when evaluating safety performance.

Mexico lifts empty-truck restriction after 700 tractors stranded at border 

Mexican customs authorities have lifted a ban on empty commercial trucks entering Mexico through the border crossing in Eagle Pass, Texas.

The ban ended a five-day disruption that stranded hundreds of tractors across the border in the Mexican city of Piedras Negras that forced carriers to scramble to reposition equipment.

Mexico’s National Customs Agency, known as ANAM, reinstated empty-truck crossings from Eagle Pass into Piedras Negras on Monday after imposing the restriction Sept. 9.

The restriction allowed trucks carrying freight to enter Mexico but prohibited empty trailers and tractors operating without trailers from crossing southbound through Piedras Negras. The local customs administration initially said the measure would remain in effect until further notice, according to Periodico La Voz.

By Monday, nearly 700 tractors were reportedly stranded in Eagle Pass without a way to return to Mexico, according to Elías Tarín, president of the Consejo Binacional de Transportistas, according to news outlet Zocalo.

Tarín said the types of permits held by affected Mexican carriers prevented them from simply sending the tractors to another crossing, such as Del Rio, Texas, to return to Mexico, The restriction also caused commercial traffic at the Eagle Pass international bridges to plummet.

Patricia Mancha, international bridge director for the city of Eagle Pass, told the City Council on Monday that commercial traffic had dropped from approximately 1,000 trucks per day to between 300 and 400.

According to WorldCity data, Eagle Pass ranked as the nation’s 10th-largest border crossing in 2025 by trade volume in March and handled $3.77 billion in total trade.  

The top commodities imported into Eagle Pass, Texas from Mexico via commercial trucks include commercial delivery trucks, passenger cars, beer, motor vehicle parts, and household appliances like refrigerators, according to the Observatory of Economic Complexity.

On Sept. 8, the day before the restriction took effect, 996 tractor-trailers crossed the city’s international bridges, according to Mancha.

The Piedras Negras-Eagle Pass gateway normally handles about 1,000 commercial vehicles daily, including loaded trucks, empty trailers and tractors operating without trailers.

The disruption also created costs for manufacturers and transportation companies that rely on the crossing.

Alejandro Ruiz Rueda, president of the regional export manufacturing association INDEX, estimated the restriction could have caused logistics losses of as much as $1 million per day.

ANAM has not publicly provided a detailed explanation for why Piedras Negras was targeted by the restriction.

The decision drew concern from transportation companies and customs brokers because empty equipment is a critical part of the cross-border freight cycle. After Mexican trucks deliver international freight into the U.S. border region, tractors and trailers often must return empty to Mexico to pick up another shipment.

CANACAR, Mexico’s national trucking association, warned during the restriction that carriers were facing additional costs, equipment accumulation and uncertainty over their operations.

Industry pressure precedes reversal

The restriction was lifted after transportation industry representatives met Monday with Mexican and U.S. officials to discuss its effects.

Tarín said representatives met with ANAM, U.S. Customs and Border Protection and the Mexican Consulate to explain the risks and consequences of continuing the restriction. Later that day, Piedras Negras customs officials issued a notice saying empty commercial vehicles could once again cross from the United States into Mexico.

The reversal also headed off a possible demonstration by truckers.

Transporters had discussed blocking access to the Piedras Negras commercial crossing Monday to protest the restriction. The planned demonstration was called off after customs authorities restored empty-truck movements.

ANAM’s reopening notice restored normal movements of empty cargo vehicles from Eagle Pass into Piedras Negras on Monday.

Separately, Mexico’s Tax Administration Service and ANAM said this week that an electrical problem affecting government servers caused intermittent outages in the country’s DODA customs-clearance document system Sept. on Monday and Tuesday. Officials said the system was fully restored by 11 a.m. Tuesday and was operating normally as of Wednesday.

That computer outage was separate from the Piedras Negras empty-truck restriction.

Why it matters: Cross-border trucking depends on the rapid repositioning of tractors and trailers, and the restrictions on empty equipment disrupted subsequent loads while loaded trucks remained free to cross the bridge connecting Eagle Pass and Piedras Negras. 

Truckload carriers: Capacity exodus growing, not slowing

a white Schneider sleeper cab pulling an orange Schneider trailer on a highway

The truckload capacity correction is still in the “early innings,” carrier executives said at an investor conference this week.

A regulatory crackdown launched a year ago compounded the impact of prolonged economic weakness, which had already forced numerous small and midsize fleets out of the industry. The recent surge in diesel fuel prices has further plagued small operators, many of whom don’t have recovery mechanisms in place. Also, the Supreme Court’s broker liability ruling adds another gating factor on capacity, requiring both brokers and shippers to more carefully select their transportation partners.

“There was no standard for entry-level driver training,” Jim Filter, Schneider National (NYSE: SNDR) President and CEO, said at Morgan Stanley’s Annual Laguna Conference.

He pointed to the thousands of drivers who joined the industry during the previous upcycle, noting that many acquired their authority unlawfully and lacked proper training. The entry point for this group has been narrowed, with the forced closure of sham driver schools. The capacity that is entering the market is being scrutinized more heavily than in the past as shippers and brokers are less likely to tender loads to new motor carriers without safety ratings. Further, strict oversight of ELD providers is keeping drivers from skirting hours-of-service rules.

These actions are continuing to remove the drivers that “were not playing by the same rules as everybody else,” Filter said.

SONAR: Outbound Tender Rejection Index (OTRI.USA) for 2026 (blue shaded area), 2025 (yellow line), 2024 (green line) and 2023 (pink line). A proxy for truck capacity, the tender rejection index shows the number of loads being rejected by carriers. Current tender rejections show a tight truckload market. To learn more about SONAR, click here.
SONAR: Carrier Details Net Changes in Trucking Authorities (CDNCA.USA) for 2026 (blue shaded area), 2025 (yellow line), 2024 (green line) and 2023 (pink line). A weekly count of the net change in motor carrier of property trucking authorities.

Executives from Werner Enterprises (NASDAQ: WERN) echoed the impacts the changes are having on carrier selection. They believe that the industry’s capacity crunch may only be in the second or third inning, noting the screws have further tightened following the broker liability (Montgomery) ruling.  

Werner’s management team cited a recent Texas Supreme Court ruling involving Home Depot (NYSE: HD). In that case, the retailer was dismissed as a defendant in a liability suit over a fatal accident that occurred while Werner was transporting its cargo. Ultimately, the court determined that Home Depot met its legal obligation simply by hiring a reputable carrier.

Filter said Schneider’s brokerage unit has culled its approved carrier list to just 14,000 from 60,000 at the peak. The company initially started removing operators a couple of years ago in efforts to thwart cargo theft.

“I can tell you that there aren’t 100,000 carriers out there that I think any of us would be able to look at and say, 100,000 carriers are safe and should be out there on the road,” Filter said.

While the dust is still settling after the Montgomery decision, he believes a large segment of carriers won’t be able to qualify for liability insurance, or the costs will become prohibitive.

Werner said the capacity shakeup has created an opportunity to convert private fleets into dedicated customers as obstacles to asset ownership have intensified.

Driver availability issues have resurfaced and private fleets don’t have dedicated teams to recruit and train. Many private fleets expanded during the pandemic and are now facing their biggest replacement cycle ever amid a high-cost equipment environment. Also, they have seen insurance costs continue to rise and now have to contemplate self-insurance as a means of managing liability risk.

Capacity, not demand, the bigger hurdle to growth?

Schneider is seeing stable demand with some pockets of strength. Minibid activity has continued as shippers “want to make sure that they are going to be protected in their most important season.” However, Schneider said demand is not the biggest hurdle to growth—it’s capacity.

“Well, with the amount of supply that has exited, it has created enough demand for our services,” Filter said. “We don’t necessarily need more demand.”

SONAR: Van Contract Rate Per Mile Index (VCRPM1.USA) for 2026 (blue shaded area), 2025 (yellow line), 2024 (green line) and 2023 (pink line). The index shows a 7-day moving average of the initial reporting of dry van contract rates without fuel or accessorial charges.

Werner said demand among its mostly discount-retail and food-and-beverage customer base has remained steady from the second quarter to the third quarter. It is seeing elevated minibid activity in its one-way segment and interest for its dedicated services has spiked.

Werner’s outlook calls for a 10% to 13% year-over-year increase in one-way rate per total mile during the third quarter. The metric was 10% higher y/y in the second quarter, with fleet utilization improving 16% y/y.

The dedicated fleet (80% of its TL network) is forecast to capture a 3% to 5% y/y increase in revenue per truck per week for full-year 2026. The metric was up 5% y/y in the second quarter, and 8% higher, excluding FirstFleet, which it acquired in January. The dedicated segment has been achieving low- to mid-single-digit contractual rate increases in recent months.

Werner cited the potential for “strong” contract rate increases in the upcoming 2027 bid season, which gets underway in the next 30 to 60 days. It will enter contract negotiations during peak season when supply tightness will be amplified.

Why it matters? Carrier options are dwindling as strict regulatory enforcement and soaring fuel prices constrict capacity. Consequently, shippers are navigating rising transportation costs, increased reliance on dedicated fleets and heightened competition to secure capacity for peak season.

More FreightWaves articles by Todd Maiden:

Norfolk Southern: New intermodal era about removing rail friction

Norfolk Southern’s intermodal business is entering a new phase in which success will depend less on simply matching trucking on cost and more on making rail freight easier to buy, plan, monitor and use, according to a company executive reflecting on the railroad’s three decades of network development and customer-service evolution.

Shawn Tureman, vice president of Automotive & Intermodal Marketing marking 23 years at Norfolk Southern (NYSE: NSC) while attending the Intermodal Association of North America’s annual conference in Long Beach, said the industry has spent much of that period asking whether intermodal can compete with over-the-road trucking. That question, the executive argued, no longer captures the central challenge.

Intermodal has long held advantages in scale, fuel efficiency, sustainability and reach on the longer-haul lanes where railroads compete. The more consequential question is whether railroads have made the service simple, reliable and visible enough for shippers and logistics providers to choose it consistently over a truck move.

That customer-experience challenge has become more pressing as supply chains adapt to an on-demand economy. Shippers are increasingly accustomed to service that is immediate, transparent and straightforward to manage. They are evaluating freight options not only on transportation price, but also on predictability, ease of execution and whether a transportation provider can support their growth.

In that context, trucking’s advantage is not always transit speed alone. A truck move can appear simpler because it typically involves one provider, one movement plan and a more direct line of accountability. Norfolk Southern’s opportunity, Tureman said, is to offer comparable ease and certainty while retaining rail’s ability to move freight at scale.

The railroad has recently shown stronger intermodal momentum. Norfolk Southern’s intermodal volume rose 13.7% year-over-year this past week, pointing to evidence that rail can capture business from the highway when its service offering is competitive.

Three eras of intermodal

Norfolk Southern’s view of the business can be divided into three distinct periods: Building the network, competing for the customer, and removing the friction that continues to constrain rail’s ability to win freight from trucks.

The first era centered on network construction. Following railroad consolidation in the late 1990s, Class I railroads invested extensively in intermodal terminals, double-stack routes, port connections and long-haul freight corridors. Those investments created the backbone of the U.S. intermodal system and established rail as a viable long-distance alternative to highway transportation.

For Norfolk Southern, that meant developing what Tureman characterized as the most extensive intermodal network on the East Coast. The railroad added terminal capacity, built or upgraded routes connecting major freight markets and improved access to East Coast ports and inland distribution centers.

The investments gave shippers an additional way to move goods over long distances and helped turn intermodal from a developing freight option into a central part of the transportation market.

But the network buildout did not eliminate the complexity facing customers.

Long-haul rail moves frequently involved multiple railroads, terminal transfers, drayage providers and service handoffs. Even in lanes where intermodal delivered a cost or efficiency advantage, customers could face service variability and uncertainty that made rail more difficult to incorporate into tightly managed supply chains.

“Cost alone does not shift a supply chain,” said Tureman.“Customers need confidence.”

The first era demonstrated that intermodal could scale, but it did not fully resolve the customer experience. In many cases, customers had to adapt their operations to the railroad rather than receiving a product designed around their needs.

Service becomes the product

The second era, which Norfolk Southern places largely in the past 15 years, shifted the industry’s attention from physical network development to customer service, terminal performance, visibility and consistency.

Shippers began to judge intermodal differently. Rather than asking only whether rail could move freight at a lower cost, they increasingly asked whether it could help them operate more effectively.

Could they plan around transit times? Would service be consistent from week to week? Could they track freight and anticipate exceptions? Would the rail service be simple for their operations teams, drayage partners and customers to manage?

That change raised the importance of the intermodal terminal, where shippers and truck drivers often experience the railroad most directly. Norfolk Southern said it has focused on terminal flow, bottleneck reduction, capacity management and tools intended to make it easier for customers and drayage providers to transact with the carrier.

The railroad also has continued investing in the underlying infrastructure that supports the service product: East Coast port connectivity, inland ports, double-stack-capable corridors, strategic terminal capacity and high-performance routes serving growing freight markets.

When terminals operate smoothly and connections are dependable, customers experience fewer pickup and delivery surprises, more reliable cutoffs and better freight visibility, the executive said. They also have a better ability to recover when disruption occurs.

That progress does not mean the railroad considers its intermodal network finished. Tureman acknowledged Norfolk Southern is not “perfect,” but said the company’s customer experience has improved materially as the railroad has placed greater emphasis on continuous improvement.

The fundamental goal is to make rail service something customers can confidently plan around rather than a lower-cost alternative that may carry too much operating complexity.

UP–NS combination seen as next step

Norfolk Southern’s proposed combination with Union Pacific (NYSE: UNP) is central to its vision for a third intermodal era focused on removing structural friction from the freight network.

The proposed transaction would link Union Pacific’s western network with Norfolk Southern’s eastern system, creating a single-line railroad connecting major West Coast markets with the Southeast, Northeast and other eastern markets. Supporters argue that a combined UP-NS railroad would reduce the complexity now associated with interline freight moves that cross between carriers.

Chicago and other major rail gateways remain a particular source of complexity for transcontinental intermodal shipments. A handoff between railroads can introduce another point at which containers must be transferred, plans can change and delays can occur. From a customer’s perspective, those handoffs can add time, uncertainty and additional coordination requirements.

Those concerns can be enough to leave freight on the highway, even when rail is otherwise a suitable transportation mode.

Under the proposed Union Pacific–Norfolk Southern combination, the railroads said about 10,000 existing lanes could shift from interline service to single-line service. The application filings also project the elimination of approximately 2,400 railcar and container handlings and 60,000 car-miles per day.

The proposal calls for seven new premium intermodal lanes and would give customers broader single-line service options across the country, according to the companies.

Single-line service can change the commercial and operational proposition for shippers. Instead of working across separate railroad commercial teams, contracts, invoices, information systems and accountability structures, customers could work with one provider for more of the coast-to-coast movement.

The result, Norfolk Southern argues, would be fewer handoffs, fewer touches, fewer potential delays and a more direct chain of accountability.

For a shipper moving cargo from a West Coast port to the Southeast or Northeast, that could mean less need to build buffer time into the supply-chain plan for an inter-carrier handoff. For logistics providers, it could reduce the effort required to manage a move across multiple railroads. And for customers choosing between rail and truck, it could make intermodal look less like a complicated exception and more like a practical, dependable option.

The broader strategic argument is that simplifying the product could help railroads capture a larger share of the long-haul truck market while reducing highway congestion and strengthening domestic supply-chain capacity.

Terminal readiness remains decisive

A transcontinental network alone will not determine whether intermodal gains share from trucking. Customers still encounter the railroad at terminals, gates, ramps and drayage handoff points, making terminal performance critical to any effort to expand rail volumes.

“The terminal is our storefront,” Tureman said.

That means terminal readiness must advance alongside network integration and commercial simplification. A railroad can offer a longer single-line route, but the value proposition can erode quickly if drivers face excessive gate queues, containers are unavailable when expected, chassis and capacity are constrained, or service exceptions are difficult to identify and resolve.

Norfolk Southern has emphasized the need for readiness before volume arrives. That includes adequate terminal capacity, staffing, processes, power, technology and operating discipline to support higher throughput.

When terminals are designed and run for velocity, customers can see the benefits directly through faster gates, lower driver dwell, smoother connections, improved visibility and quicker recovery from disruption. Conversely, an unprepared terminal can make intermodal difficult to use regardless of the strength of the broader rail network.

The railroad has linked its ongoing terminal work to the larger potential created by a combined UP–NS network. Norfolk Southern is seeking to improve the daily customer touchpoints in its existing system while supporting a longer-term vision of more integrated, accountable transcontinental rail service.

From competing with trucks to standing out

The progression Norfolk Southern describes is straightforward: first, railroads built the network; then they worked to improve the service product; now they must remove friction at terminals, interline handoffs and other points where complexity discourages customers from choosing rail.

The objective is not to ask shippers to accept the operational complications of intermodal in exchange for a lower price. Instead, it is to redesign the rail product so that complexity is absorbed by the carrier network rather than passed on to the customer.

That would allow intermodal to compete on the factors that increasingly drive freight decisions: Predictability, transparency, simplicity and accountability, in addition to cost and capacity.

If railroads can provide dependable terminal experiences, clearer visibility, fewer inter-carrier handoffs and a single accountable partner across long-haul lanes, Tureman say, intermodal can become more than an alternative to over-the-road transportation. 

“It can become a preferred option for moving the country’s freight.”

Subscribe to FreightWaves’ Rail e-newsletter and get the latest insights on rail freight right in your inbox.

Read more articles by Stuart Chirls here.

Read more:

Container delays by rail increase at busiest U.S. ports

U.S. container imports climb 3.8% to 2.6 million TEUs, 3rd highest monthly level

Houthi gains deepen risk as carriers restore Red Sea services

Almost 1 million TEUs in new record for this U.S. container gateway

SC Ports, Norfolk Southern expand intermodal access to Huntsville