Chart of the Week: Freightos Baltic Daily Index – China to North America West, China to Mediterranean SONAR: FBXD.CNAW, FBXD.CMED
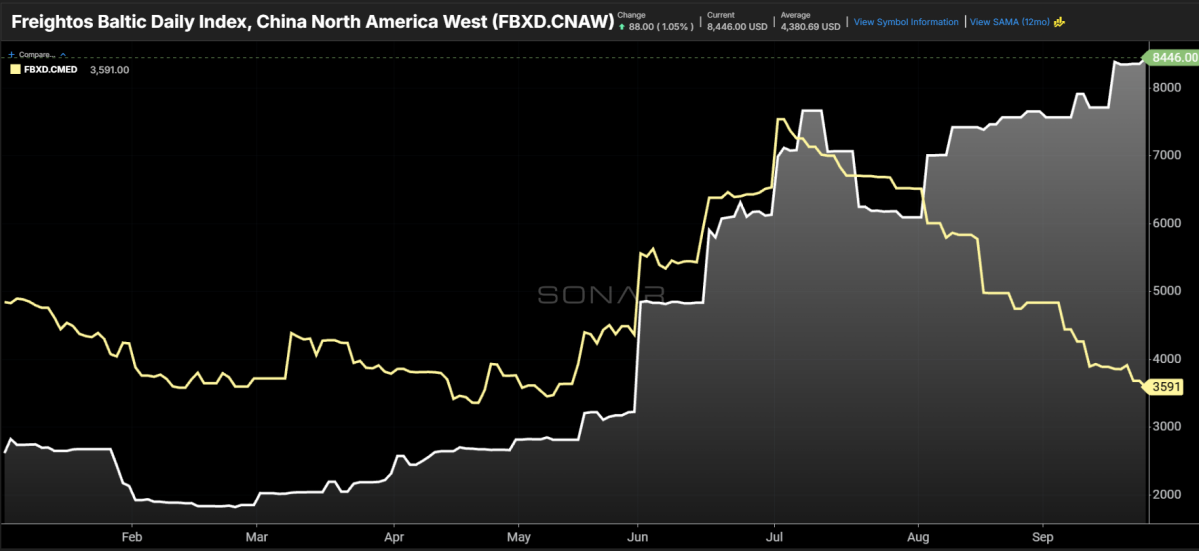
Container rates from China to the North American West Coast and to the Mediterranean climbed together through June and into July. Over the past seven weeks they have split completely, and demand explains very little of the gap.
The Freightos Baltic Daily Index for China to North America West (FBXD.CNAW) closed at $8,446 per forty-foot equivalent unit (FEU) on September 23. That is nearly double its 12-month average of $4,381 and about four times what shippers paid in September 2025. The China-to-Mediterranean index (FBXD.CMED) has gone the other way. It has fallen to $3,591 per FEU, down more than 50% from its July peak of $7,540 and now below where it started the year.
In January, moving a box from China to Genoa or Valencia cost about 1.7 times as much as moving one to Los Angeles. Now the relationship has flipped: a West Coast box costs 2.35 times as much as a Mediterranean one.
A spread that wide usually means American importers are fighting for space while European demand dries up. SONAR’s port-pair ocean booking data says otherwise.
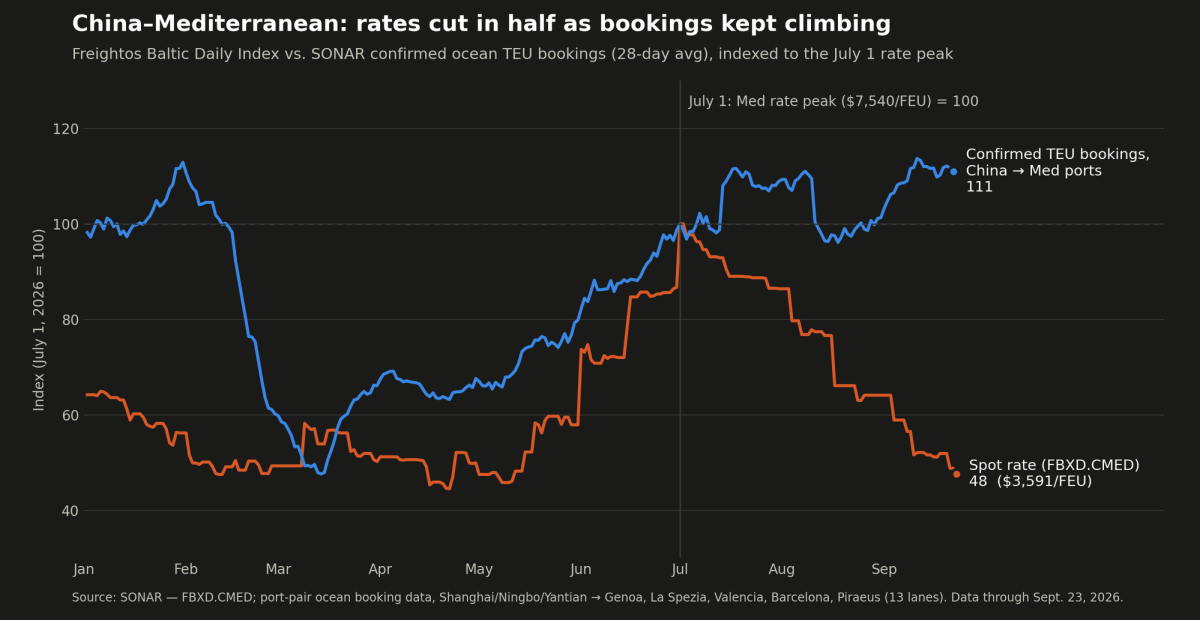
Confirmed TEU bookings from Shanghai, Ningbo and Yantian to five major Mediterranean ports are up 38% from a year ago, and 11 of 13 lanes show year-over-year growth. On a 28-day average, bookings are up roughly 11% since the July 1 rate peak. Bookings from the same Chinese ports into North Europe are up 26% year over year and 7.5% since July. European demand is not collapsing. It is holding steady or growing even as rates have been cut in half.
On the North American West Coast, the booking data is less uniform. Total confirmed TEUs from China to the U.S. and Canadian West Coast are up about 50% from last year. Nearly all of that growth, however, comes from Long Beach, where bookings on all three origin lanes have more than doubled. The median West Coast lane is up only about 1% year over year. Bookings into Los Angeles from Ningbo are down 33%, and Oakland and Seattle are down on most lanes. Even at the most generous reading, volumes are rising at a fraction of the pace of rates.
Bookings aren’t a perfect proxy for containers loaded, since some are canceled or rolled to later sailings. But growth this large and this widespread is hard to explain away as noise.
If demand isn’t driving the split, supply is at least pointing in the direction.
On Asia-Europe, carriers have been gradually shifting services back through the Suez Canal. Maersk and Hapag-Lloyd moved four more Asia-Europe services off the Cape of Good Hope routing this month, and Suez container tonnage is up 54% year-to-date. The shorter route frees up vessels that had been tied up in Cape diversions, so effective capacity is growing faster than cargo. Carriers are also rejecting fewer Mediterranean bookings than a year ago, 7.1% versus 8.3%, a sign of increasing availability.
The trans-Pacific has lost capacity instead. Typhoon-driven congestion at Chinese hubs since mid-July has pulled ships out of rotation and disrupted schedules. Carriers have leaned heavily on blank sailings, announcing nine in a single week this month. Bunker fuel costs are also rising again with tensions around the Strait of Hormuz, which raises the floor on the longest routings. Xeneta reported that only 29% of vessels arrived on time globally in August, the third straight monthly decline.
But supply alone doesn’t explain the size of the moves. SONAR data shows carriers are rejecting fewer West Coast bookings than a year ago, 8.3% versus 10.1%, even as rates have quadrupled. That suggests space is being rationed by price rather than a shortage of ships. Spot rates price only the cargo not covered by annual contracts, and with 10 carriers controlling roughly 90% of global capacity, small changes in available space are turning into outsized price swings in both directions.
The next test comes in early October, when exporters rush to move cargo before China’s Golden Week factory shutdowns. Analysts expect one more push on trans-Pacific rates before the holiday. After that, rates could ease as congestion clears and the capacity carriers have been holding back returns to the Pacific. If the Mediterranean is any guide, trans-Pacific rates can fall quickly even while bookings hold up.
About the Chart of the Week
The FreightWaves Chart of the Week is a chart selection from SONAR that provides an interesting data point to describe the state of the freight markets. A chart is chosen from thousands of potential charts on SONAR to help participants visualize the freight market in real time. Each week a Market Expert will post a chart, along with commentary, live on the front page. After that, the Chart of the Week will be archived on FreightWaves.com for future reference.
SONAR aggregates data from hundreds of sources, presenting the data in charts and maps and providing commentary on what freight market experts want to know about the industry in real time.
The FreightWaves data science and product teams are releasing new datasets each week and enhancing the client experience.
To request a SONAR demo, click here.
Brokerage Compliance Symposium
The day before F3. Every compliance issue you face - fraud exposure, carrier liability, FMCSA rules, cargo theft, insurance gaps - navigated by attorneys and operators defining best practices in a changing industry.
F3 Awards Dinner
The night before F3. FreightTech100 companies honored. FreightTech 25 and Shipper of Choice winners revealed live. Cocktail reception into dinner and live music - 300 industry leaders in one purpose-built room.
F3: Future of Freight Festival
Industry-defining keynotes, rapid-fire technology demos, and industry leaders networking in experiences across Chattanooga - plus the inaugural F3 Awards Dinner featuring the FreightTech and Shipper of Choice reveals.
The day before F3. Every compliance issue you face - fraud exposure, carrier liability, FMCSA rules, cargo theft, insurance gaps - navigated by attorneys and operators defining best practices in a changing industry.
The Signal at Chattanooga Choo Choo • Chattanooga, TN Register NowThe night before F3. FreightTech100 companies honored. FreightTech 25 and Shipper of Choice winners revealed live. Cocktail reception into dinner and live music - 300 industry leaders in one purpose-built room.
The Signal at Chattanooga Choo Choo • Chattanooga, TN Register NowIndustry-defining keynotes, rapid-fire technology demos, and industry leaders networking in experiences across Chattanooga - plus the inaugural F3 Awards Dinner featuring the FreightTech and Shipper of Choice reveals.
The Signal at Chattanooga Choo Choo • Chattanooga, TN Register Now