
CarrierLists, in partnership with FreightWaves, introduces The Freight Source Survey, a new survey developed that monitors where carriers source loads. We plan to publish the results on a regular cadence. The first survey resulted in 533 small to mid-sized carriers participating. The carriers were asked to break down percentages of freight they handled by source.
Carriers were given four choices: shipper direct, load board, direct from brokers, or digital freight apps.
An index based on fleet size reveals approximately 63% of load offerings come via direct interaction between the carrier and shipper, while 23% of the loads came from direct contact with brokers and 14% from the use of an online load board. Almost none of the volume comes from the use of digital freight apps.
Digital freight apps, such as Convoy, Transfix, and Uber Freight have made a huge splash in the media for their desire to disrupt the incumbant players. Currently, that does not appear to be the case. Time will tell if the digital players gain traction on the market or the traditional freight brokers start to blend digital and traditional freight brokerage in their operations.

The survey shows 321 of the 533, or 60% of the participants, have fleet sizes ranging from five to 15 trucks. The data implies that roughly 80% of the small size fleets have a direct interaction with shippers when receiving their freight.
The ratio appears to move toward a more even distribution as the fleet size increases, implying the larger carriers are utilizing load boards and interacting with freight brokers with more frequency than the smaller carriers. The carriers who operate with more than 100 trucks utilize brokers and load boards almost twice as often as their smaller sized peers. Load boards tend to be used for transactional freight, when the carrier does not have a consistent brokerage relationship on a lane. The data suggests that 14% of all load selections come off of load boards, which combined with brokerage-direct sourced freight, represents 37% of the entire market.
With there being two load boards in the survey question (DAT and Truckstop), we learned just how outsize of a role they play in the freight market versus the direct capacity-sales efforts of the 16,000+ freight brokers.
The discrepancy makes sense. Smaller carriers generally are not targeted by the brokerage houses due to lower visibility in the marketplace. The data implies that the small carriers are potentially an untapped resource for brokerage houses and carriers that utilize outsourcing around the country.
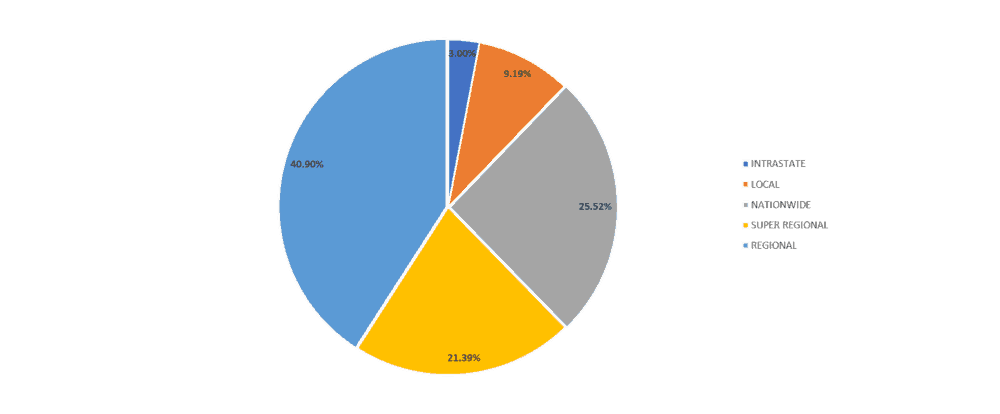
The surveys also show small to mid-sized carriers tend to classify themselves as regional. With the growing market for final mile deliveries and a shift to more regional distribution, it’s possible to envision a change in this dynamic if carrier visibility changes.
Having a good list of small to mid-size carriers can be a large advantage to shippers and brokers. The smaller carriers help leverage the market rates by offering a lower rate compared to the bigger companies as they have less overhead to incorporate into their pricing. They also tend to be more customer-focused, providing a better customer service experience due to the fact they simply have less to monitor.
One of the most daunting and time-consuming tasks for brokerage houses and shippers is finding a reliable carrier that offers competitive pricing. Ongoing maintenance of a carrier base takes lots of time and energy that can be used in other areas. Keeping carriers honest as service issues and rate increases arise is one of the main values of a brokerage company. Just like it is in investing, a diversified carrier portfolio is essential to any healthy logistics program.
The random-sample survey included 533 carriers, representing 12,121 trucks, out of 867,000 for-hire OTR trucks. The confidence level is 95% that the sample represents the population (+-1%).
Stay up-to-date with the latest commentary and insights on FreightTech and the impact to the markets by