International Roadcheck Week – Haul freight or take a vacation?
Last year, carriers avoided hotspots for vehicle inspections during CVSA’s Roadcheck week. Now the market has turned, so has their attitude about these areas.
Capacity normally tightens into the holiday weekend, but this Memorial Day is nothing like the previous years.
The trade war between China and the U.S. is having a noticeable impact on freight markets. Shippers and carriers are struggling to adapt.
The relationship between truckload and less-than-truckload (LTL) is like two cities positioned around the epicenter of an earthquake.
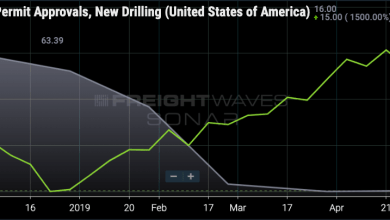
FreightWaves’ SONAR chart of the week (May 5, 2019 – May 11, 2019) Chart of the Week: Drilling Permit Approvals, New Drilling (USA) vs. WTI crude oil price (SONAR: DRILLNEW.USA, WTI.USA) The rise in crude prices is not resulting in an increase in the rig count and particularly not an increase in new drilling permits. […]
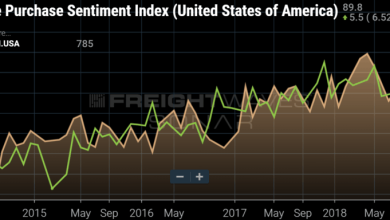
The housing market has been sliding since early 2018, but there are optimistic signals for a turnaround in 2019. Freight markets can only benefit from a strong housing market.
The inbound container flows had a big impact to freight volumes in the port cities of Savannah and Los Angeles this past year.
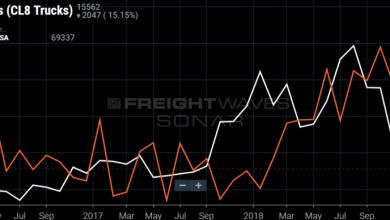
National spot market price movement has a surprisingly tight relationship with new truck orders.
Capacity is still being added to the market. Truck orders numbers for both new and used models support this.
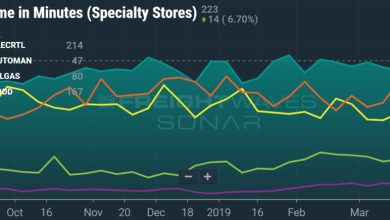
Specialty retail and electronics retail stores are the least efficient loading and unloading docks for carriers according to FreightWaves latest index.
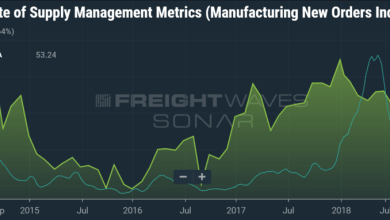
Manufacturing numbers are not looking as robust after a booming early 2018. The flatbed freight market may be in line for a big correction as well.
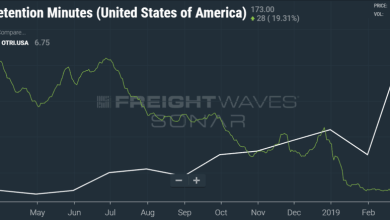
After a period of attempting to improve detention times with carriers, they appear to be falling into the old habits of making load/unload times are lower priority according to FreightWaves’ Detention Minutes Index.
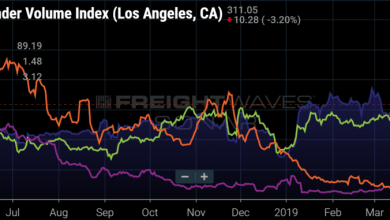
Los Angeles has had the heaviest freight volumes in the U.S. for the past several months, but carriers should be paying attention to where that freight is headed.
National freight volumes are flat year-over-year, but capacity is as loose as ever. What is driving the discrepancy?
Increasing spot rates lead carrier revenues in 2018, will revenues start to fall now that rates have started to come down again?
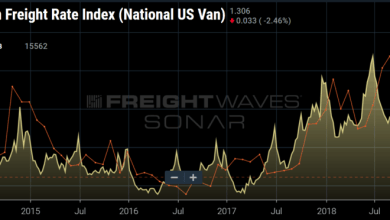
National spot rates have been flying high for the past year, but have only recently fallen under previous year values as illustrated on FreightWaves newest charting feature.
Atlanta to Philadelphia’s spot rate has hit its lowest point in 3 years. The absolute rates may be similar, but the freight markets could not be further apart.
The two Super Bowl teams and their fanbases are very different, just like their freight market identities.
The DOE fuel price keeps sliding as wholesale or rack prices are increasing. This can have a negative impact to carrier margins in early 2019 after receiving the benefit of expanding fuel spreads in late 2018. SONAR’s newest index can help you monitor this.
How can air cargo and dry van spot market rates be related? Could the movement of these two seemingly unrelated rates provide more evidence the market is slowing?