
This week’s FreightWaves Supply Chain Pricing Power Index: 60 (Carriers)
Last week’s FreightWaves Supply Chain Pricing Power Index: 65 (Carriers)
Three-month FreightWaves Supply Chain Pricing Power Index Outlook: 50 (Carriers)
The FreightWaves Supply Chain Pricing Power Index uses the analytics and data in FreightWaves SONAR to analyze the market and estimate the negotiating power for rates between shippers and carriers.
The Pricing Power Index is based on the following indicators:
Accepted freight volume falling closer to year-ago levels
Although January and February posted unseasonably high tender volumes, the first quarter of 2022 will end not with a bang but with a whimper. The Outbound Tender Volume Index (OTVI) tumbled further this week, continuing along a downward trend started at the beginning of March.
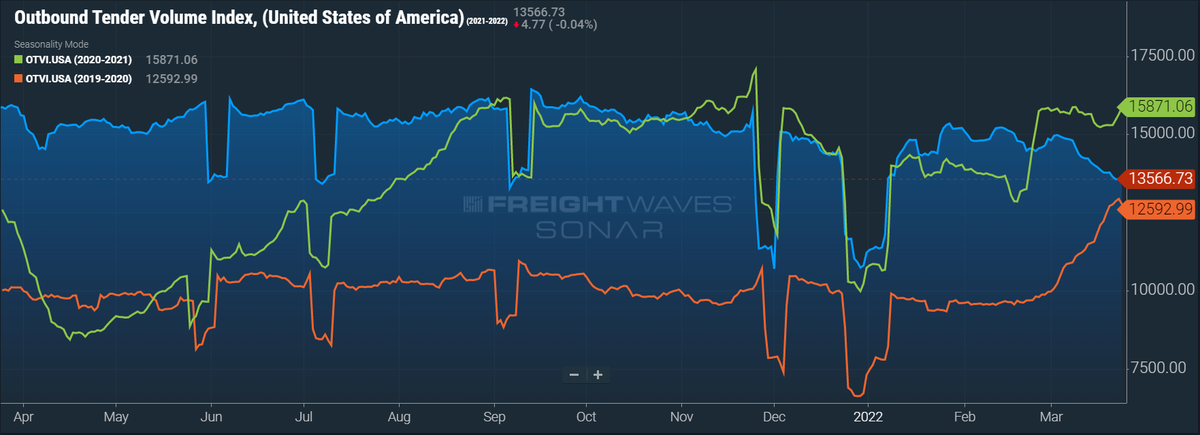
SONAR: OTVI.USA: 2021-22 (blue), 2020-21 (green) and 2019-20 (orange)
To learn more about FreightWaves SONAR, click here.
OTVI declined by 2.15% over the past week and is down 14.5% year-over-year (y/y), though OTVI is facing difficult comps on a y/y basis. Aside from the much-discussed rejection rates spurred by winter storms in February 2021, the last week of Q1 2021 saw a third round of stimulus checks mailed out to Americans. Because spending on services (e.g., restaurants, sporting events) was hamstrung by COVID-prevention measures at the time, consumers instead spent their stimulus checks on big-ticket retail goods like furniture and online electronics, providing a boost to the truckload market.
Looking at accepted tender volumes, which is OTVI adjusted by the Outbound Tender Reject Index (OTRI), we see slight growth by 0.56% y/y but also a decline by 0.87% week-over-week (w/w). A steep decline in tender rejections has enabled favorable y/y comparisons for accepted tender volumes thus far, but a falling OTRI can only offset weakened freight demand to a point. Expect to see a y/y decline in accepted volume next week.
Some economists are bracing for a recession, pointing to substantial inflationary pressures, an extremely tight labor market and geopolitical uncertainties that are impacting supply chains. After climbing for 11 consecutive weeks, gasoline prices are now rising at the fastest rate on record, leading Congress to consider sending “gas rebate” checks to offset the rising prices. In a conference held on Monday, Federal Reserve Chairman Jerome Powell explained the tightrope being walked by the Fed: either hold interest rates steady and risk greater inflation or raise rates and possibly precipitate a recession.
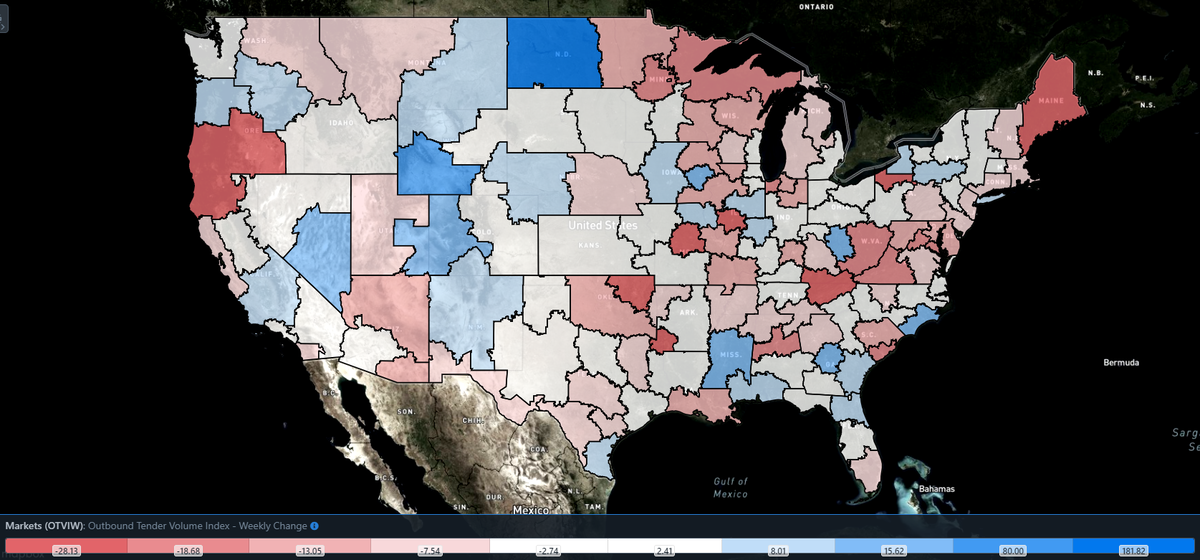
SONAR: Outbound Tender Volume Index – Weekly Change (OTVIW).
To learn more about FreightWaves SONAR, click here.
Most of the larger markets saw a contraction in freight volume this week, though tender volumes rose in a few interesting regions. Of the 135 total markets, only 47 reported weekly increases. Savannah, Georgia, which is home to one of the largest seaports on the East Coast, saw an 8.8% increase in outbound volume w/w. Ontario, California, which hosts freight from the busiest seaport complex in America, saw only a slight boost in outbound volume by 1.1% w/w. Without sparking a ’90s-style rivalry, these changes mirror the overall shift in shippers’ attitudes as they move imports from West Coast ports to their less congested (but also smaller) counterparts on the East Coast.
Markets in southern Texas and Florida are experiencing a boost in tender volume, likely aided by produce moving out of the regions. The Texan cross-border market of McAllen saw an 8.6% increase in outbound volume, while Jacksonville, Florida, saw weekly growth by 9.8%.
By mode: Mirroring the overall OTVI, both reefer and dry van volumes are down this week. Van volumes are declining at a slower rate, as the Van Outbound Tender Reject Index (VOTVI) is down only 1.34% this week. Although VOTVI is down 14.15% y/y, accepted van volumes are up a slight 0.92% y/y.
The Reefer Outbound Tender Volume Index (ROTVI) is less of a cause for celebration, as it is currently down 4.1% w/w. It is well worth reiterating the difficult comps ROTVI faces on a y/y basis, since the index can be inflated by high rejection rates and reefer tender rejection rates were close to 50% this time last year. Therefore, although ROTVI is down 31% y/y, accepted reefer volumes are only down 0.39% y/y.
Carriers ‘swiping right’ on tenders faster than any point in the past 20 months
OTRI continues to fall, finally dropping beneath 16% and rapidly approaching 15%. Major shockwaves will soon be felt by carriers, particularly by those that are new to the industry.
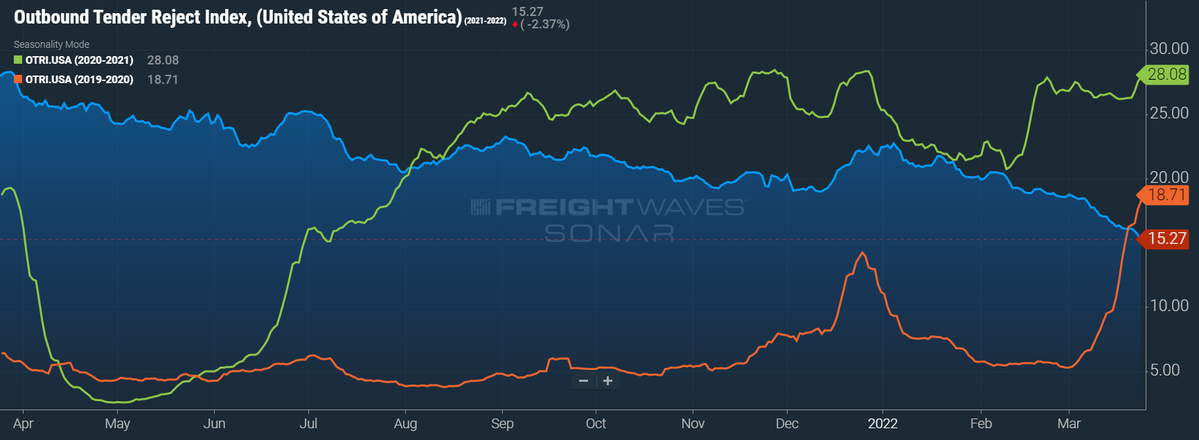
SONAR: OTRI.USA: 2021-22 (blue), 2020-21 (green) and 2019-20 (orange)
To learn more about FreightWaves SONAR, click here.
Over the past week, OTRI, which measures relative capacity in the market, fell to 15.27%, a change of 109 basis points (bps) from the week prior. OTRI is now 1,265 bps below year-ago levels, albeit against unchallenging comps from a time when rejection rates were spiraling out of control.
Although shippers are surely pleased with the continued decline in tender rejections, some perspective might put today’s numbers in focus. On Christmas Day in 2019, when rejection rates reached their yearly high, OTRI was at 14.25%, a full 102 bps lower than levels today. Meanwhile, OTRI’s average throughout 2019 was 6.17%, indicating that current rejection rates still need to fall before returning to pre-pandemic levels of “normal.”
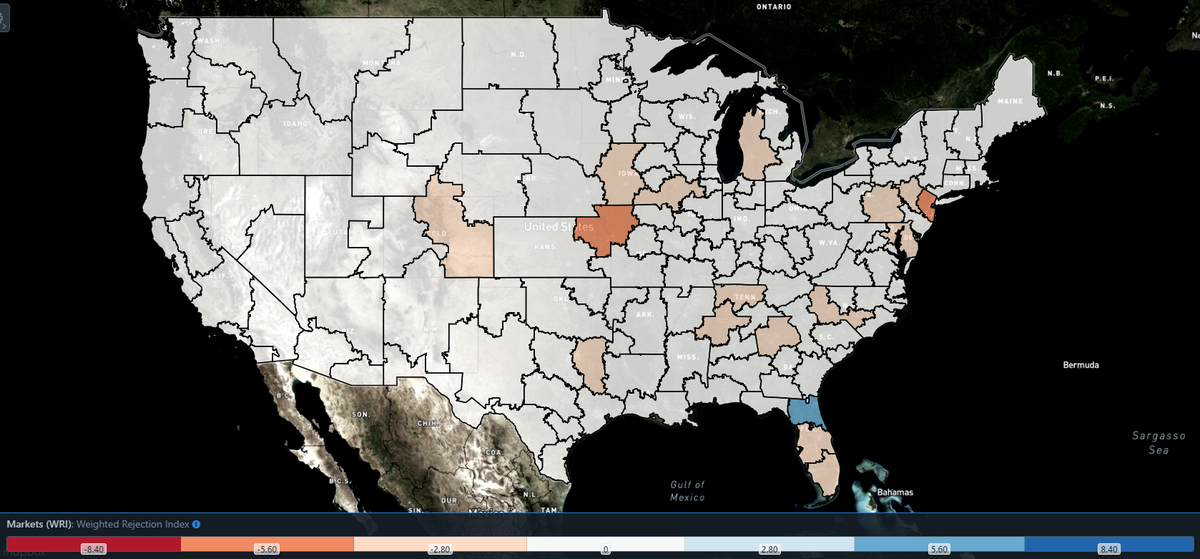
SONAR: WRI (color)
To learn more about FreightWaves SONAR, click here.
The map above shows the Weighted Rejection Index (WRI), the product of the Outbound Tender Reject Index – Weekly Change and Outbound Tender Market Share, as a way to prioritize rejection rate changes. As capacity is generally finding freight, there are only a handful of blue markets, which are the ones to focus attention on.
Of the 135 markets, only 40 reported higher rejection rates over the past week as carriers compete for loads among quieter freight demand.
Jacksonville is one of the markets currently hit hardest by rising rejection rates. Because of the state’s small manufacturing base, Florida is generally seen as an unattractive destination for carriers, which often deadhead upward of 250 miles to find freight from neighboring states. The situation changes, however, during produce season, which sees volume levels rise. The growth in volume begins in the southern tip of Florida and, as the season progresses, gradually climbs northward.
To learn more about FreightWaves SONAR, click here.
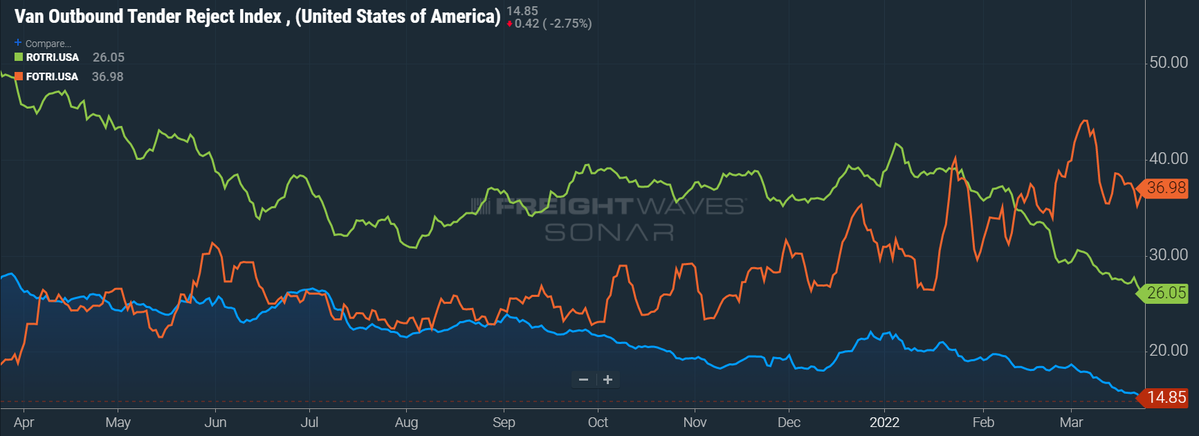
By mode: Rejection rates fell across all modes this week, though flatbed rejections are still higher compared to year-ago levels. The Flatbed Outbound Tender Reject Index (FOTRI) currently sits at 36.98%, 1,841 bps higher on a y/y basis. Mortgage interest rates are at their highest in three years, signaling a likely cooldown on the red-hot housing market. Nevertheless, flatbeds will be in demand as construction begins on recovery efforts in tornado-stricken regions of the South.
Van rejection rates continue to drive the decline in the overall OTRI, as the Van Outbound Tender Reject Index (VOTRI) is now at 14.85%, a full 116 bps lower w/w. Capacity conditions in the reefer market are also easing, as the Reefer Outbound Tender Reject Index (ROTRI) fell 150 bps to 26.05%.
Easing trends and elevated contract rates lead to further downturn in spot rates
The spot rate data available in SONAR from Truckstop.com is updated every Tuesday with the previous week’s data.

SONAR: Truckstop.com’s national spot rate (blue, right axis) and dry van contract rate (green, left axis).
To learn more about FreightWaves SONAR, click here.
The Truckstop.com national spot rate, based on the top 100 lanes on Truckstop.com’s load board, continued to drop as capacity loosened across the markets. The national spot rate, after reaching an all-time high of $3.83 per mile in early January, now sits at just $3.42 a mile, which includes fuel surcharges and other accessorials.
Of the 102 lanes from Truckstop.com’s load board, 36 reported spot rate increases last week, up from 21 lanes the week prior. This decline in the average spot rate, coupled with the unstoppable rise in contract rates, is likely to help shift pricing power into shippers’ favor.
Last week, contract rates set a record high at $2.94 per mile, but this week brings a new all-time high in the dataset. Contract rates, which are the base linehaul rate excluding fuel surcharges and other accessorials that are included in spot rates, rose 2 cents per mile this week, as contract rates are now sitting at $2.96/mi.
FreightWaves’ Trusted Rate Assessment Consortium (TRAC) spot rate from Los Angeles to Dallas has yet to experience any correction whatsoever, as the downward spiral in rates has continued uninterrupted since the beginning of 2022. This week, the rate fell 6 cents per mile to $2.83. Although capacity has tightened in Los Angeles somewhat as carriers chase seasonal trends in volume, freight volume has declined in equal measure.
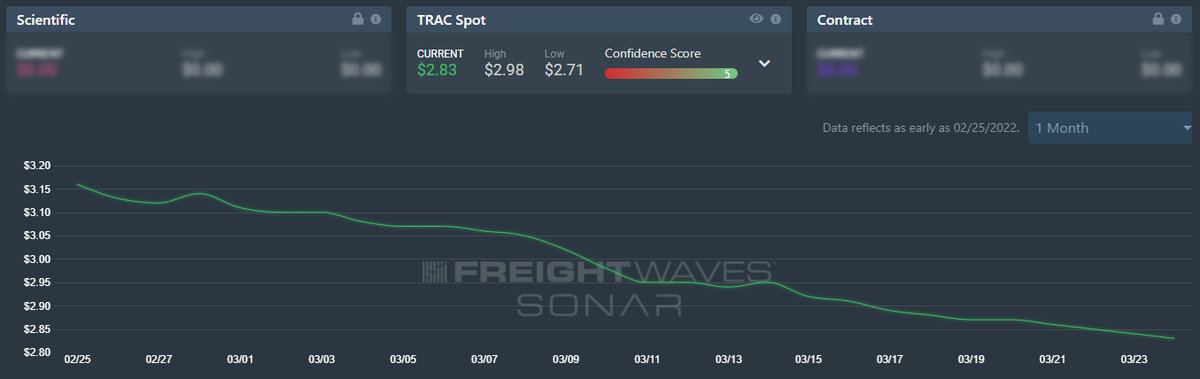
To learn more about FreightWaves TRAC, click here.
The FreightWaves TRAC spot rate from Atlanta to Philadelphia also dipped this week, despite capacity in the Atlanta region growing tighter. The rate from Atlanta to Philadelphia now sits at $3.73 per mile, down 5 cents a mile from the previous week. Volume levels in Atlanta, which is currently the largest freight market by outbound volume, fell by an unseasonable 7% this week. If volume levels continue to drop in the region, outbound spot rates will continue to follow.

To learn more about FreightWaves TRAC, click here.
The lack of stability leading into the close of the first quarter is likely the biggest cause for concern as shippers traditionally cause an uptick in freight demand during the final week of quarters. With the traditional truckload cycle lasting three years, the good fortunes that carriers have experienced over the past year may be coming to an end, as highlighted by Craig Fuller, FreightWaves’ founder and CEO, in his recent article, “Just 3 years after 2019’s trucking bloodbath, another is on the way.”
For more information on the FreightWaves Freight Intel Group, please contact Kevin Hill at khill@www.freightwaves.com or Tony Mulvey at tmulvey@www.freightwaves.com.
Supply Chain AI Symposium
Past the hype. Join operators, founders, and enterprise leaders figuring out how to deploy AI in supply chain.
F3: Future of Freight Festival
Industry-defining keynotes, rapid-fire technology demos, and industry leaders networking in experiences across Chattanooga - plus the inaugural F3 Awards Dinner featuring the FreightTech and Shipper of Choice reveals.
Past the hype. Join operators, founders, and enterprise leaders figuring out how to deploy AI in supply chain.
The Old Post • Chicago, IL Register NowIndustry-defining keynotes, rapid-fire technology demos, and industry leaders networking in experiences across Chattanooga - plus the inaugural F3 Awards Dinner featuring the FreightTech and Shipper of Choice reveals.
The Signal at Chattanooga Choo Choo • Chattanooga, TN Register Now