


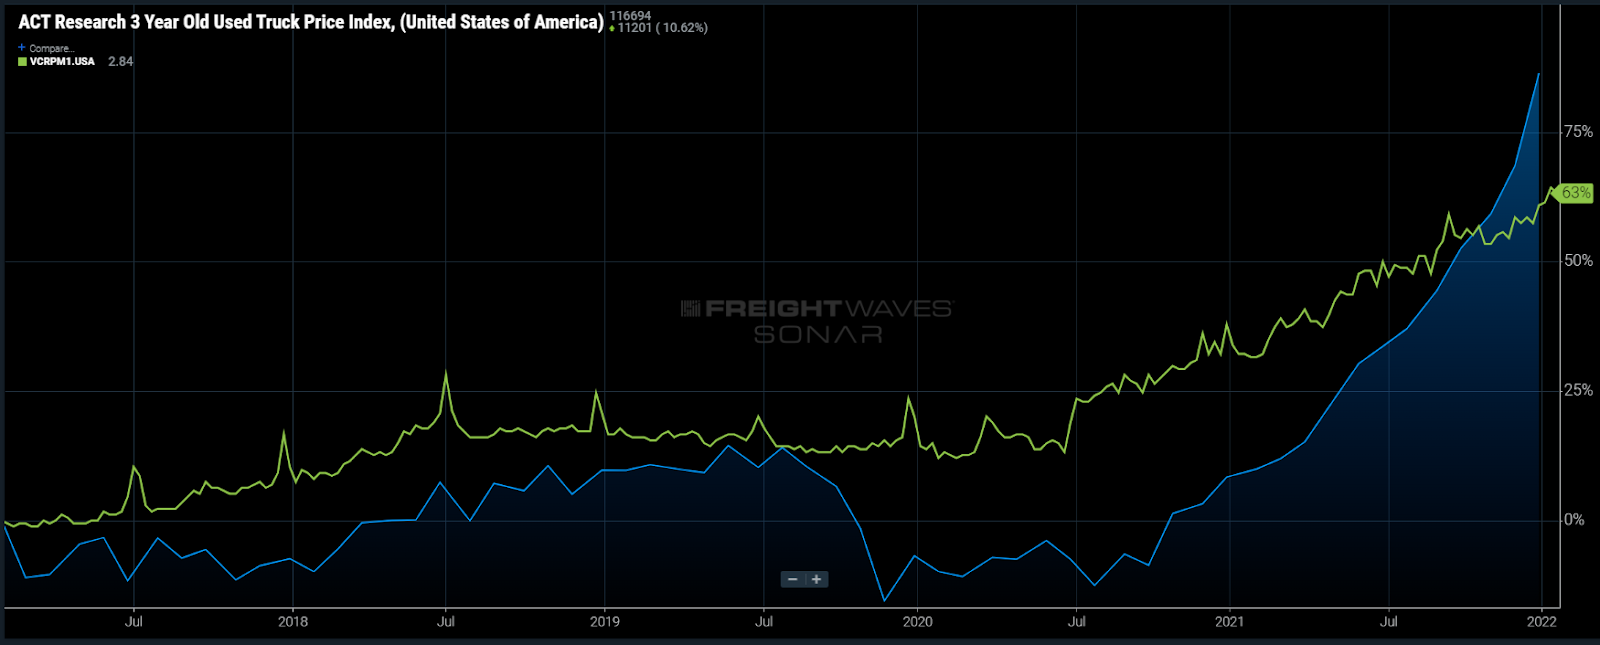
Chart of the Week: ACT Research 3 Year Old Used Truck Prices, Van Contract Rate Per Mile Initial Report – USA SONAR: UT3.USA, VCRPM1.USA
The cost of used 3-year-old Class 8 trucks (UT3) has increased 70% over the past year, according to ACT Research. The average rate per mile for contracted van freight (VCRPM1) has only risen 20% over the same time. The disparate rate of increase between costs of operating and the sell rate for truckload capacity will curtail small business growth in the long run as well as put many more at risk for failure if the market turns.
While everything may be looking all right for most carriers at this point, there are many potential problems looming on the horizon as a result of such an inflationary environment, and the smaller business model has the highest level of exposure. First, we need to put the current market in the context of a similar environment that occurred not that long ago.
The recent level of demand has overwhelmed transportation infrastructures for nearly 18 months and has been difficult for many people to understand exactly how it has persisted with little sign of easing. It is highly unusual for transportation capacity to be in such a short supply for this long without some level of correction.
The demand side expansion in 2017-18 resulted in a dramatically oversupplied market in 2019. That cycle lasted roughly 10-12 months and was not nearly as expansive as the current environment. While the 2018 and this most recent demand cycle are very different in causation, there are many similar problems that can occur at the end.
In 2018-19 capacity expanded to meet demand. There was some reduction in industrial activity off of what was an overstimulated capital investment environment, but the unusually long period of tightened capacity inspired many fleets to expand rapidly without much inhibition — very unlike the most recent environment, which has been limited by supply chain bottlenecks for equipment production and increased hiring challenges. The 2019 freight market was an extremely deflationary period on the spot market, with many loads moving at discounts off their contracted rates.
Active spot markets are much more important for smaller carriers as they do not have the scale to get an audience with larger shippers and their networks are much more difficult to balance with consistent contracted freight. When the market is oversupplied, the spot market provides less reliable volumes, leaving smaller carriers taking unprofitable loads just to break even.
While a market downturn negatively impacts all carriers, the larger fleets have a much better chance at survival. While this is an obvious future risk, rapid cost inflation poses a more near-time threat to growth.
Smaller carriers do not have the same buying power as the larger fleets and will purchase used trucks as a more affordable growth strategy. Any purchases made now will hit the balance sheet for many years. Even if truck prices fall, their exposure to these high costs remains thanks to the debt and depreciation.
These higher costs do not decline if the truckload spot market rates and volumes fall. Many large carriers unloaded equipment to take advantage of the used truck market and were able to build up cash or invest in other ways.
In many instances carriers are reportedly getting more than what they originally paid for the unit. This is evidenced by a few publicly traded companies reporting record gains on sale in the third quarter last year like Heartland Express, which is also coming under fire for a lack of growth mentality.
This type of environment favors the larger company in just about any industry as they have access to many inputs at a lower cost and higher availability than the smaller entity. In other words, growth comes at a much higher cost to a smaller company in a high-inflation environment and will potentially carry consequences after conditions stabilize.
About the Chart of the Week
The FreightWaves Chart of the Week is a chart selection from SONAR that provides an interesting data point to describe the state of the freight markets. A chart is chosen from thousands of potential charts on SONAR to help participants visualize the freight market in real time. Each week a Market Expert will post a chart, along with commentary, live on the front page. After that, the Chart of the Week will be archived on FreightWaves.com for future reference.
SONAR aggregates data from hundreds of sources, presenting the data in charts and maps and providing commentary on what freight market experts want to know about the industry in real time.
The FreightWaves data science and product teams are releasing new data sets each week and enhancing the client experience.
To request a SONAR demo, click here.
