


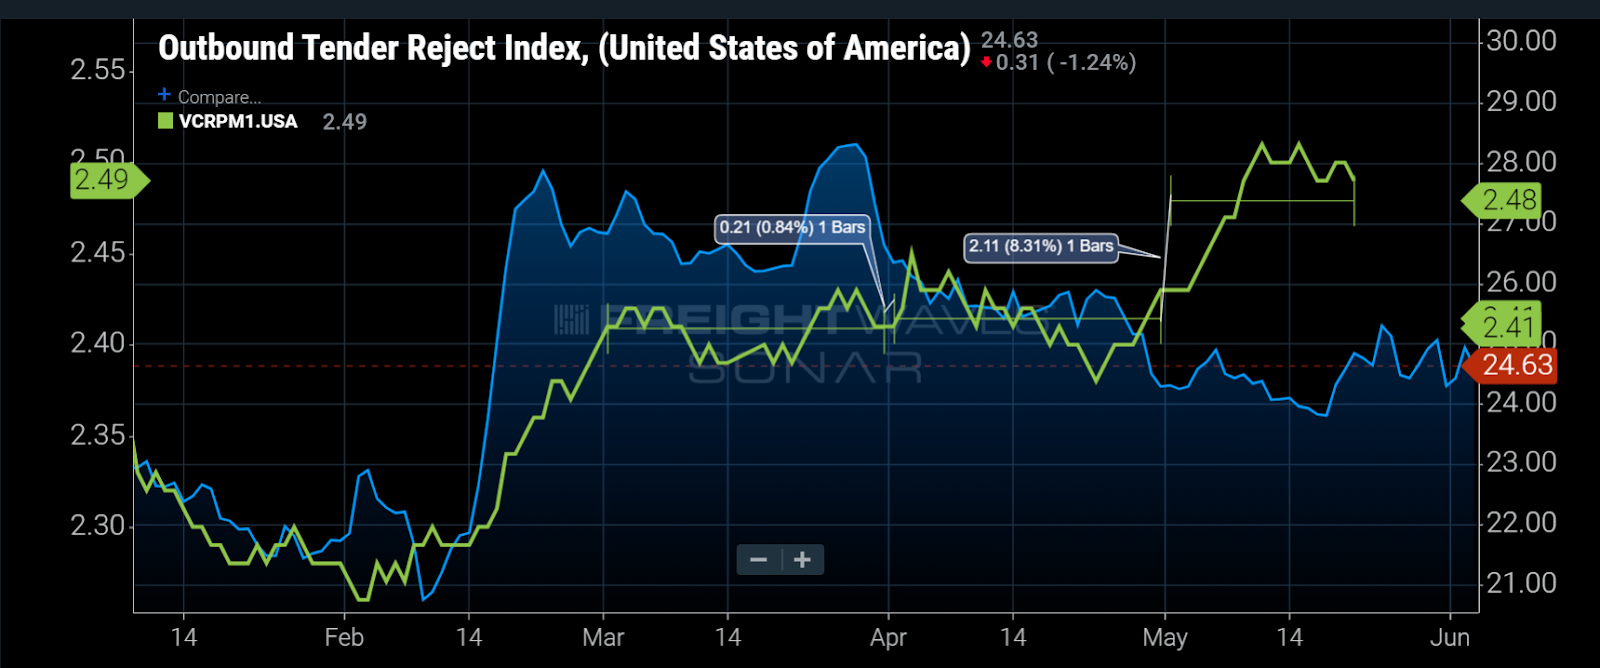
Chart of the Week: Van Contract Rate Per Mile Initial Report, Outbound Tender Reject Index – USA SONAR: OTRI.USA, VCRPM1.USA
National tender rejection rates declined about a percentage point on average in May as demand edged higher. The natural thought would be that capacity or the supply of equipment has increased, but the data suggests this was probably due to the increase in long-term or contract rates.
The Outbound Tender Volume Index (OTVI) increased 0.94% in May while tender rejection rates fell from 25.6% to 24.5% on average, indicating more loads were moved under contracted prices last month.
The national Van Contract Rate Initial Report Index (VCRPM1) that measures invoiced contracted freight rates on a 14-day lag shows shippers paid almost 8% more through the first half of May than in April. Even though the index can be moved by freight moving longer or shorter lengths of haul, it is unlikely that all of the increase can be accounted for in this way.
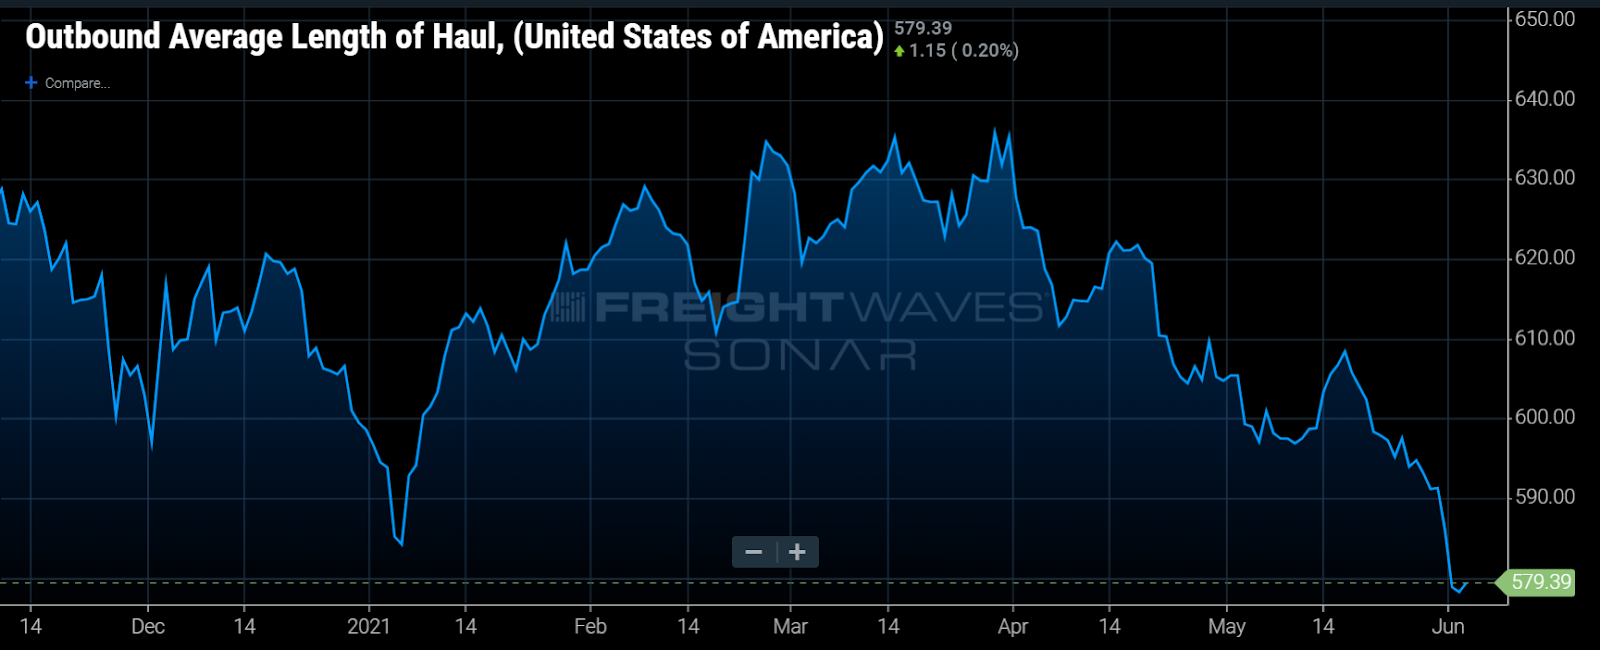
One of the biggest changes to the national freight market in 2021 is the shift in imports to other areas of the country as shippers attempt to avoid the congestion around the Los Angeles ports. This has led to more freight entering closer to the final destination on the East Coast, shrinking the average distance a load needs to travel.
Even with maritime rates hitting all-time highs, the spread between shipping a forty-foot equivalent unit to the North American east coast vs. west coast is under $2,000, according to the Freightos Baltic Exchange Index — far less than a truckload moving from Los Angeles to Philadelphia when capacity is readily available.
Freight is moving shorter distances, which could also inflate the average rate per mile to an extent, but loads moving less than 250 miles are excluded from the calculation, limiting the impact of minimums.
The big takeaway is that rate increases have been largely ineffective this year. Even as rates increase, a large amount of freight ends up on the spot market. So what does this mean for shippers?
Increasing transportation costs are the obvious answer. Many shippers took significant increases in 2018 only to see some of it clawed back in 2019. There is little doubt the current market is unsustainable and will move toward equilibrium, but a big reason costs inflated so dramatically during the pandemic was the mass exodus of trucking companies resulting from an oversupplied market.
Rates came back down in 2019, but capacity eased as well, leaving the market more exposed to surging demand and runaway rate inflation. It may be hard to see, but this pendulum-style freight economy started in 2015 after a long period of stable growth from the Great Recession in 2009.
One possibility carriers, shippers and brokers need to consider is that the “new normal” may be extended periods of excess and tight capacity. A more methodical and targeted approach may be needed to navigate this amount of volatility by all parties involved.
About the Chart of the Week
The FreightWaves Chart of the Week is a chart selection from SONAR that provides an interesting data point to describe the state of the freight markets. A chart is chosen from thousands of potential charts on SONAR to help participants visualize the freight market in real time. Each week a Market Expert will post a chart, along with commentary, live on the front page. After that, the Chart of the Week will be archived on FreightWaves.com for future reference.
SONAR aggregates data from hundreds of sources, presenting the data in charts and maps and providing commentary on what freight market experts want to know about the industry in real time.
The FreightWaves data science and product teams are releasing new data sets each week and enhancing the client experience.
To request a SONAR demo, click here.
