


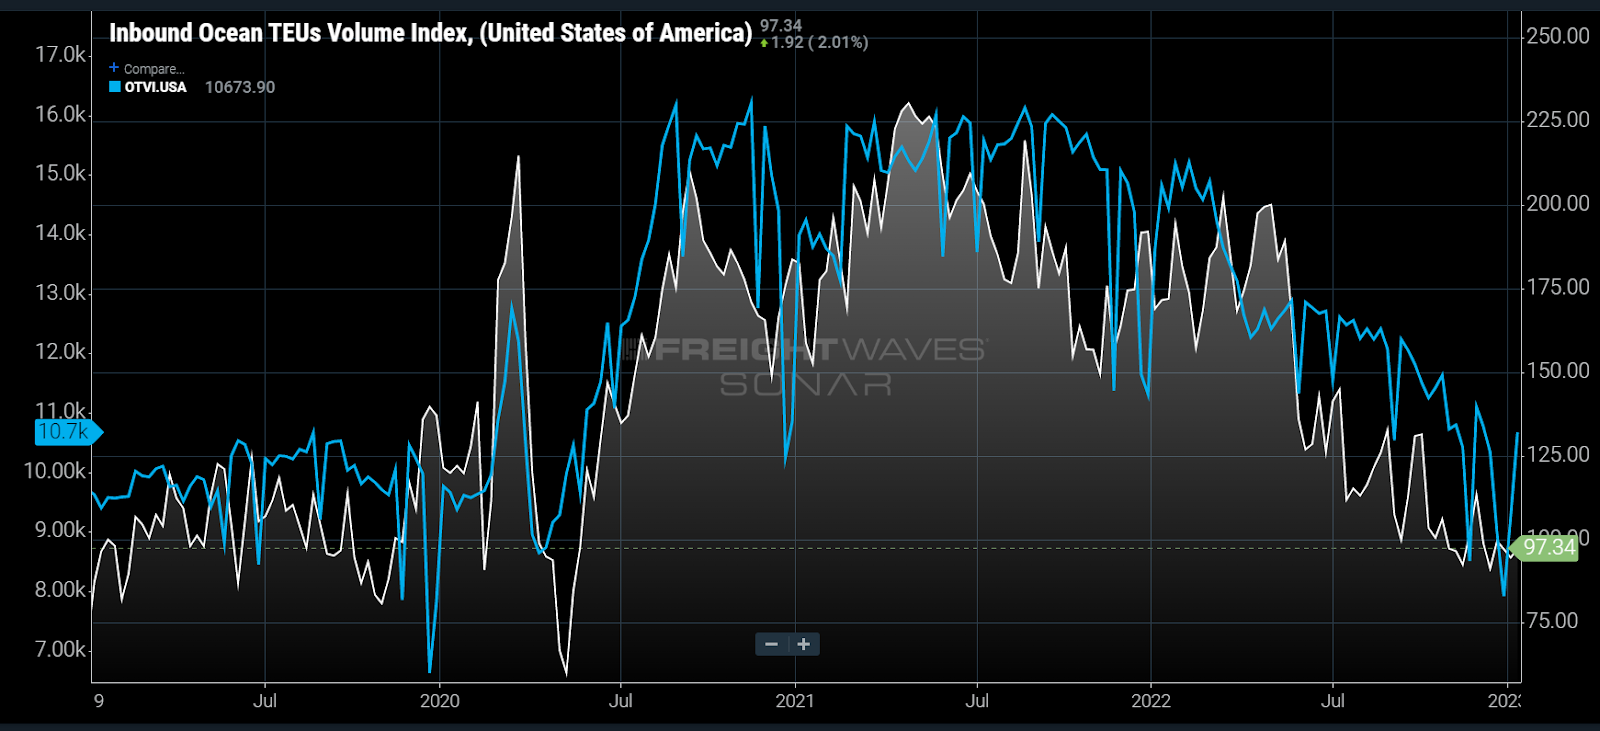
Chart of the Week: Inbound Ocean TEUs Index, Outbound Tender Volume Index – USA SONAR: IOTI.USA, OTVI.USA
From January 2019 through the first two weeks of January 2023 companies have booked container imports nearly in sync with asking for domestic truckload capacity over the past four years. As inventories correct, that is changing. But their direction remains similar entering ’23.
The correlation between import bookings (IOTI) and truckload tenders (OTVI) was 0.81 during this period. A 1 means they move in tandem, a 0 is no connection at all, and minus-1 is a perfect inverse relationship.
The Inbound Ocean TEUs Index (IOTI) is a 10-day moving average measuring twenty-foot equivalent bookings based on departure date from various ports of origin around the world destined for the U.S.
The Outbound Tender Volume Index (OTVI) is a seven-day moving average measuring electronic requests or tenders from shippers requesting truckload capacity for a shipment. The fact these two indexes have even a moderate direct correlation with no lag is surprising, considering most imports do not land in the U.S. for several weeks and have an erratic timeline as to when they, if ever, get loaded on a truck. The key is understanding the commonality between the two values.
The overlap between these two indexes is they measure companies’ demand for freight transportation services. The strong straight correlation means shippers were simultaneously placing import orders while requesting domestic truckload capacity, not leading it.
During the pandemic years of 2020-21, companies needed a near constant flow of freight to keep up with demand. This led to a strengthening link in ordering timing between import and domestic transportation. Companies needed constant inventory replenishment since they would sell it as fast as they would get it.
The connection between import bookings and truckload tenders was strongest in March and April 2020 in the weeks leading into and during the initial pandemic shutdown. The correlation fell apart early in ’22 when trucking demand plummeted in March, but import booking activity remained steady until mid-May.
Trucking demand’s decline leading imports’ is counterintuitive, but downstream processes are more reactive than upstream in volatile environments. Imports consist of orders placed weeks or months before anticipated sales. Demand forecasting has been a near impossibility since early ’20.
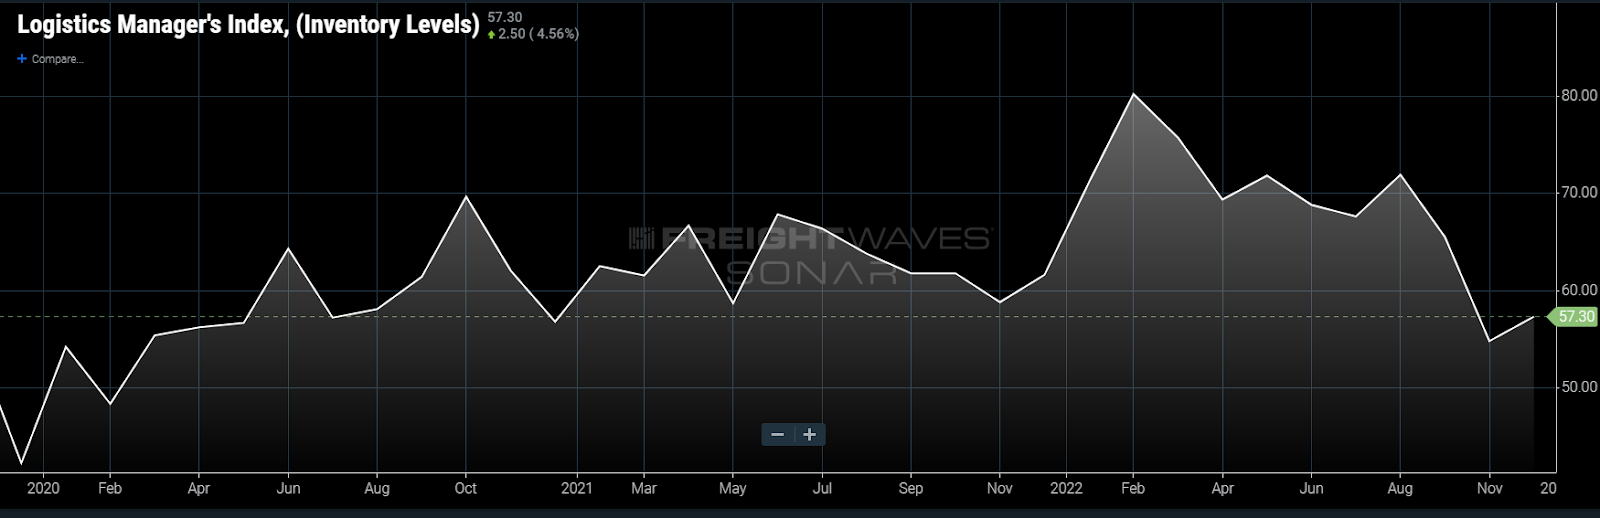
The Logistics Manager’s Index (LMI) measures inventory level expansion (values above 50) and contraction (values below 50) based on surveys of supply chain professionals from over 300 companies of various sizes on a monthly basis. The LMI showed record-level inventory expansion in winter ’22, peaking over 80 in February. It is no coincidence that the OTVI fell dramatically in March.
It took companies a while to turn off the import order valve as there was no overt sign that goods demand would stop that quickly. Companies also had been burned the previous year by expecting demand to slow.
Import bookings fell seasonally in late ’20 and led trucking demand’s decline that winter. Companies were more than likely expecting the surge in goods demand to fall back as it normally does after the new year. A second stimulus check, continued lockdowns and extreme weather reinvigorated the consumer and constricted transportation networks, leaving many companies once again unable to meet their customers’ needs.
While the direct correlation between bookings and trucking tenders has loosened, the general direction remains nearly identical entering ’23. Since early July, the OTVI and IOTI have fallen roughly 20% and 30%, respectively. Neither index has displayed any strong erratic behavior as they fall at a more consistent rate.
The takeaway is that the goods economy is still in a transitory state as demand continues to erode. Morgan Stanley transportation analyst Ravi Shanker stated that he sees a potential bottoming coming in the first half of the year as inventories rightsize but hedges that belief with concerns about macroeconomic health.
There was no seasonal uptick in the IOTI in December in preparation for Chinese New Year production shortfalls, indicating many shippers feel they have sufficient inventory for the next several months. The next checkpoint for these indexes will be in March when seasonal demand typically returns.
About the Chart of the Week
The FreightWaves Chart of the Week is a chart selection from SONAR that provides an interesting data point to describe the state of the freight markets. A chart is chosen from thousands of potential charts on SONAR to help participants visualize the freight market in real time. Each week a Market Expert will post a chart, along with commentary, live on the front page. After that, the Chart of the Week will be archived on FreightWaves.com for future reference.
SONAR aggregates data from hundreds of sources, presenting the data in charts and maps and providing commentary on what freight market experts want to know about the industry in real time.
The FreightWaves data science and product teams are releasing new datasets each week and enhancing the client experience.
To request a SONAR demo, click here.
