
The highlights from Tuesday’s SONAR reports are below. For more information on SONAR — the fastest freight-forecasting platform in the industry — or to request a demo, click here. Also, be sure to check out the latest SONAR update, TRAC — the freshest spot rate data in the industry.
FreightWaves releases newest index to SONAR
One of the key takeaways from FreightWaves’ Future of Supply Chain event in Rogers, Arkansas, was that tech companies — and there are a lot of them — are the ones taking the supply chain industry into the future.
Whether it be offering better visibility through a new TMS or efficiency through autonomous processes, tech companies are undoubtedly moving the industry forward.
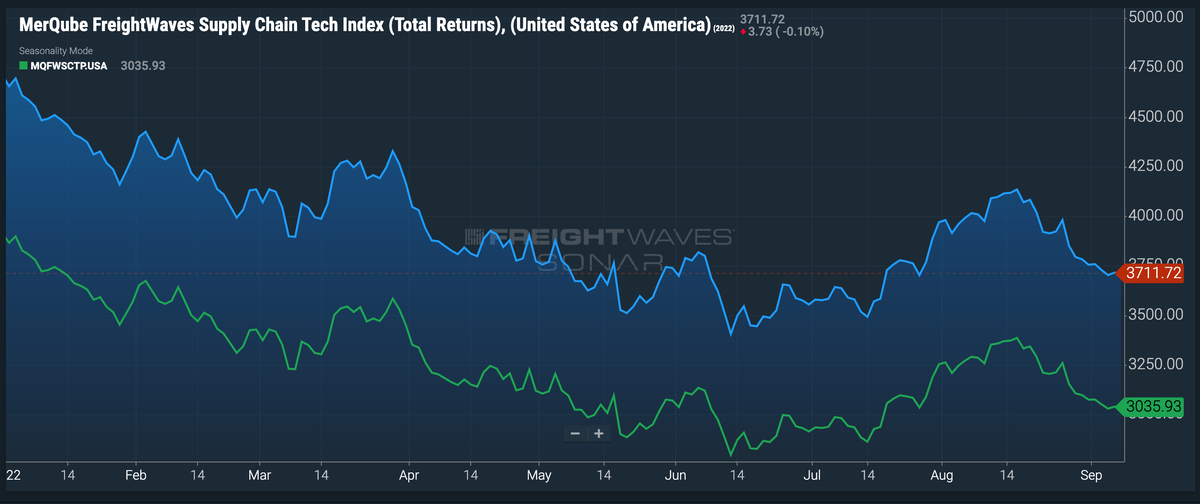
FreightWaves has partnered with MerQube to measure investment sentiment specifically in the supply chain technology sector.
On Tuesday, SONAR launched the new index, the MeQube FreightWaves Supply Chain Tech Index, which features two different tickers: Total Returns (MQFWSCTT) and Price Returns (MQFWSCTP).
The former measures the total returns of these publicly traded companies, including the dividends paid to shareholders. The latter measures only the actual stock value part of the calculation.
The following sectors are considered for inclusion in the index: tech-enabled third-party logistics (3PL); logistics software; e-commerce logistics; alternative energy/autonomous technology; and asset-heavy technology investments. Companies on the index have a minimum float market cap of $500 million and a minimum average daily value traded of $3 million.
Financial institutions, transportation companies, investment firms, supply chain and transportation managers can use the index to gauge investment interest in the sector and also to benchmark their performance versus the financial markets.
Market watch for Sept. 13
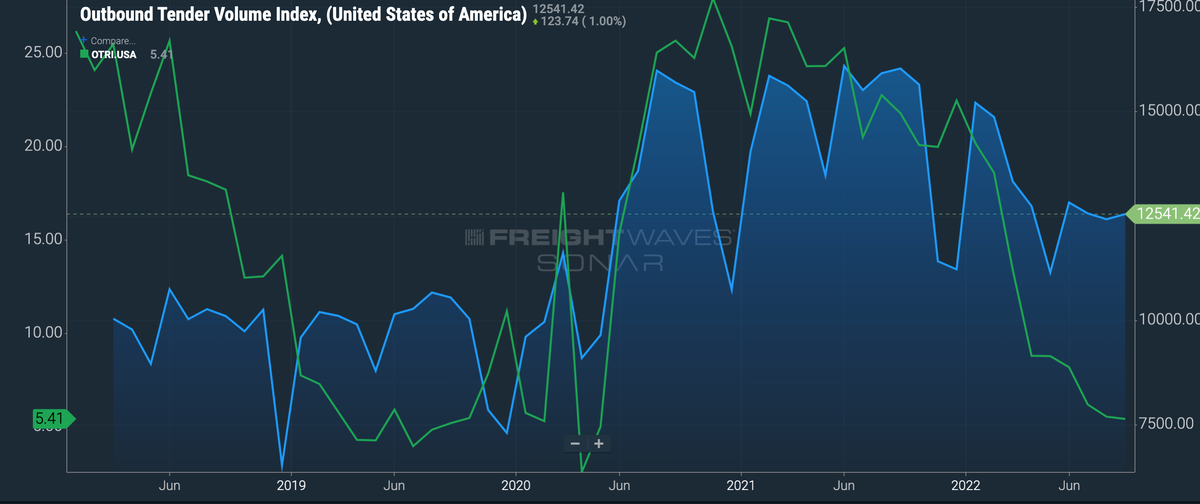
Outbound volumes across the U.S. are settling back to their levels from before the recent Labor Day holiday.
Though national outbound tender volumes have been trending down since the start of the year, they leveled out in late May and early June to significantly less than the industry was seeing during the two heightened years of the pandemic but still remain well above pre-pandemic levels. As summer comes to a close, it will be interesting to see if volume spikes back up as shippers prepare for the holiday peak season.
Rejection rates, however, have continued their decline and reached pre-pandemic levels. The national average for outbound tender rejection rates sits at 5.4%, the lowest it has been since April 2020. This is an indication of the continuous increase in capacity, as demand has stagnated.
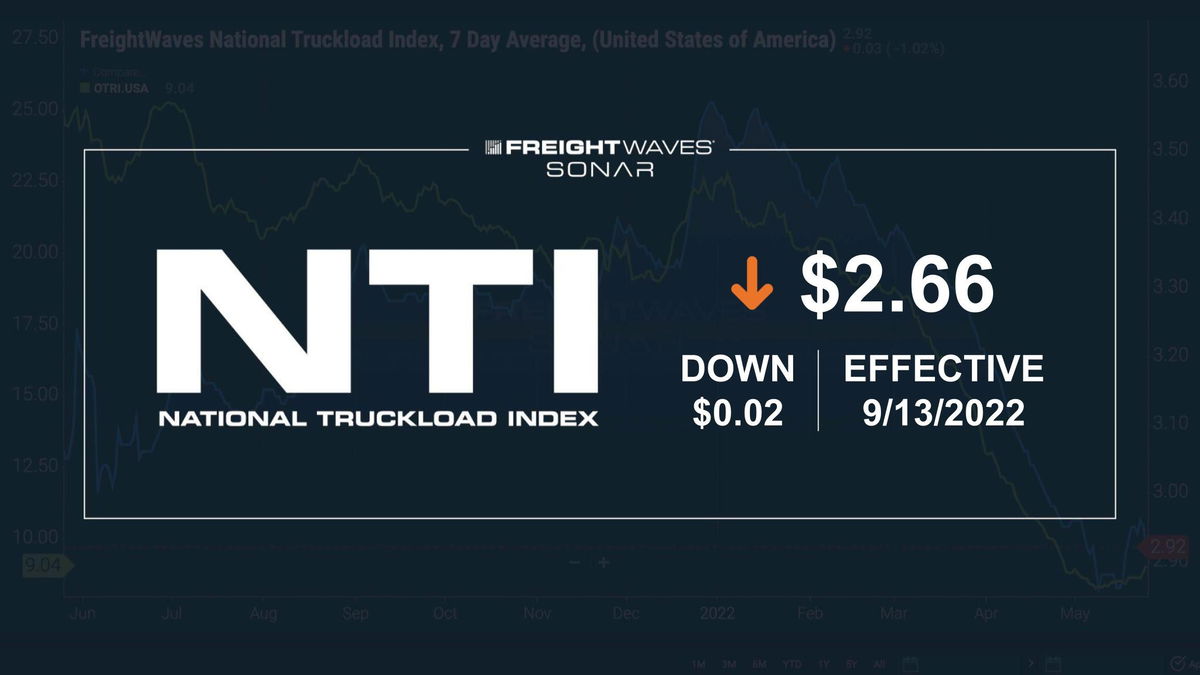
NTI as a point of reference
The National Truckload Index is a daily look at how spot rates in specific lanes hold up in comparison to the national average, giving carriers and brokers an idea of which lanes to gravitate toward or avoid.
Watch: Carrier update
Freight Fraud Symposium
Double brokering. AI deepfakes. Identity theft. Freight fraud is an existential threat to the industry. Get ahead of it.
Supply Chain AI Symposium
Past the hype. Join operators, founders, and enterprise leaders figuring out how to deploy AI in supply chain.
Future of Rail Symposium
Reshoring is rewriting freight demand. Join shippers, rail executives, and government officials to shape the next decade.
Double brokering. AI deepfakes. Identity theft. Freight fraud is an existential threat to the industry. Get ahead of it.
Rock & Roll Hall of Fame • Cleveland, OH Register NowPast the hype. Join operators, founders, and enterprise leaders figuring out how to deploy AI in supply chain.
The Old Post Office • Chicago, IL Register NowReshoring is rewriting freight demand. Join shippers, rail executives, and government officials to shape the next decade.
The Signal at Chattanooga Choo Choo • Chattanooga, TN Register Now