
Welcome to our newest FreightWaves feature. To take advantage of all the information generated by SONAR — the fastest freight-forecasting platform in the industry — we’ll post a SONAR update file each weekday. Consider it a highlight reel of the SONAR news being delivered that day via newsletters, FreightWavesTV, video, social media and all other platforms in which SONAR appears. For more information on SONAR or to request a demo, click here.
Lanes to watch
By Zach Strickland
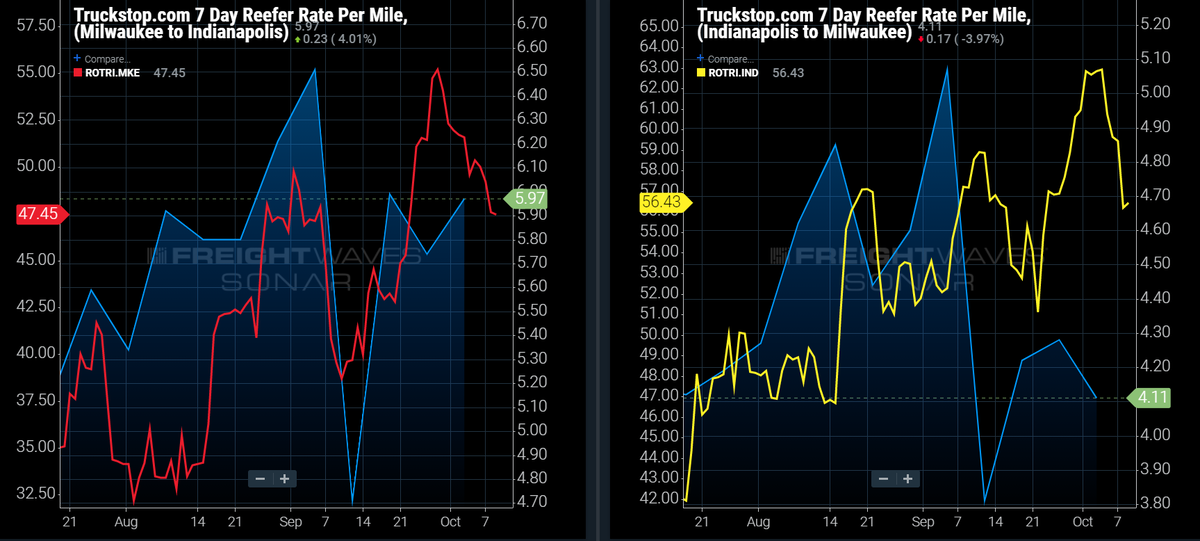
MILWAUKEE to INDIANAPOLIS: Reefer carriers average just over $5.00 all-in rpm on round-trip loads between Milwaukee and Indianapolis.
Highlights
- Reefer rejection rates have trended downward, but remain elevated at 47.45% in the Milwaukee market, allowing carriers to average $5.97 all-in rpm on the MKE–IND lane last week.
- Reefer rejection rates fell to 56.43% in the Indianapolis market, pushing the average carrier rates down to $4.11 all-in rpm.
- Milwaukee shippers have decreased reefer outbound tender lead times to 4.10 days, but capacity remains extremely tight in the market.
What does this mean for you?
Brokers: The MKE–IND lane has consistently averaged an elevated rate for reefer carriers this year as shippers struggle to find capacity for their loads. Brokers should search the spot market for reefer freight that runs between the Milwaukee and Indianapolis markets, helping shippers find capacity for their loads. Increase your bids since reefer rejection rates are elevated in both markets, and carrier rates will be expensive for on-demand capacity. Try to bundle the loads for a reduced rate and keep the same carriers running your freight.
Carriers: Reefer carriers with trucks inbound into the Milwaukee market should search the spot market for loads that deliver into the Indianapolis market. Carriers averaged $5.97 all-in rpm last week on the lane, but spot rates for on-demand capacity should be well above the average rates. The Indianapolis market will be a strong destination point for reefer carriers since the market is overbooked, and rejection rates are elevated at 56.53%.
Shippers: Milwaukee shippers need to push reefer tender lead times back out even though rejection rates are trending downward. Reefer rejection rates are still elevated at 47.45%, indicating that capacity is still tight, and spot rates for on-demand capacity remain elevated. Extending reefer tender lead times can open additional options for capacity, helping shippers avoid the high costs for on-demand capacity.
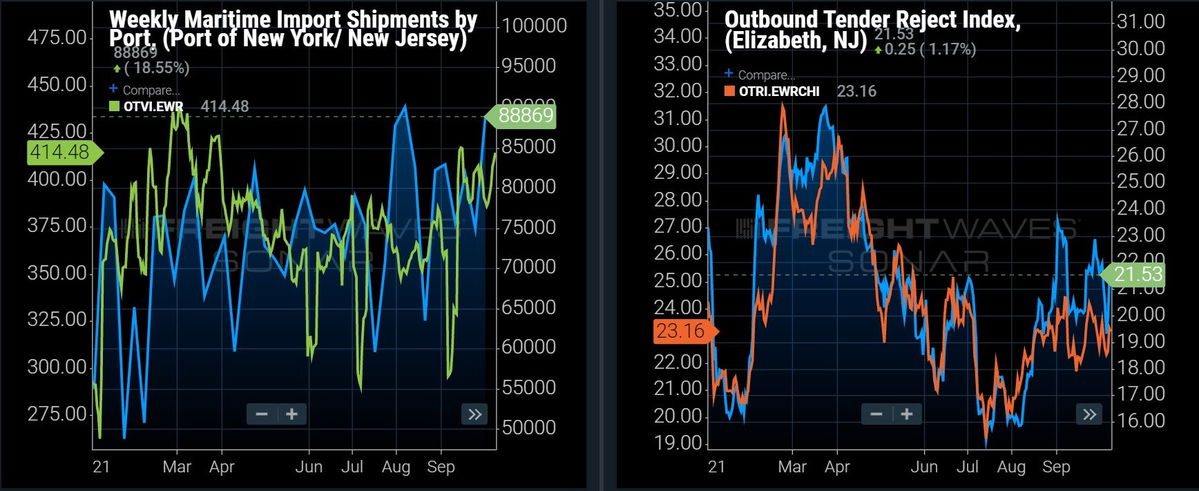
ELIZABETH (New Jersey) to CHICAGO: Another record week for import shipment volumes into the Port of NY/NJ is likely to push outbound volumes to new highs for 2021.
Highlights
- Elizabeth outbound volumes are up 6% week-over-week (w/w), but with the number of vessels waiting to deliver import cargoes, expect outbound volumes to surge for weeks.
- Elizabeth’s outbound tender rejections are relatively flat w/w, but lane-specific rejections to Chicago are 163 basis points (bps) higher for a total of 23.16%.
- The Port of NY/NJ had another record week for import shipment volumes last week, so outbound volumes are still likely to push to new heights for 2021.
What does this mean for you?
Brokers: Import volumes continue to pour into the Port of NY/NJ at record levels, so outbound volumes can be expected to continue their current upward trend for at least the next 4 to 5 weeks. Thus, it is likely that outbound volumes will reach a new record high for 2021, but could even surpass the enormous levels reached in the fourth quarter of 2020. With outbound volumes still having this much room to run, the increase in demand is likely to cause the Elizabeth to Chicago lane to get much tighter in the weeks ahead.
Carriers: Stay firm on your rates as pricing power in the Elizabeth market is highly likely to shift further in your favor in the week ahead. Outbound volumes are positioned to surge in the weeks ahead and could reach new all-time highs. This increase in demand is likely to cause a significant tightening in capacity in the Elizabeth market at a time when demand is surging at major port-side markets around the country. This is likely to put a major amount of upward pressure on spot rates in the weeks ahead.
Shippers: You should be preparing now for a capacity crunch in the coming weeks. Your shipper cohorts have actually decreased lead times w/w, so they will likely be caught off guard during what is likely to be a massive outbound volume surge in the Elizabeth market. If you go ahead and push your tender lead times to between 3 and 4 days, you can likely help keep your costs to a minimum while having a better chance at securing capacity.
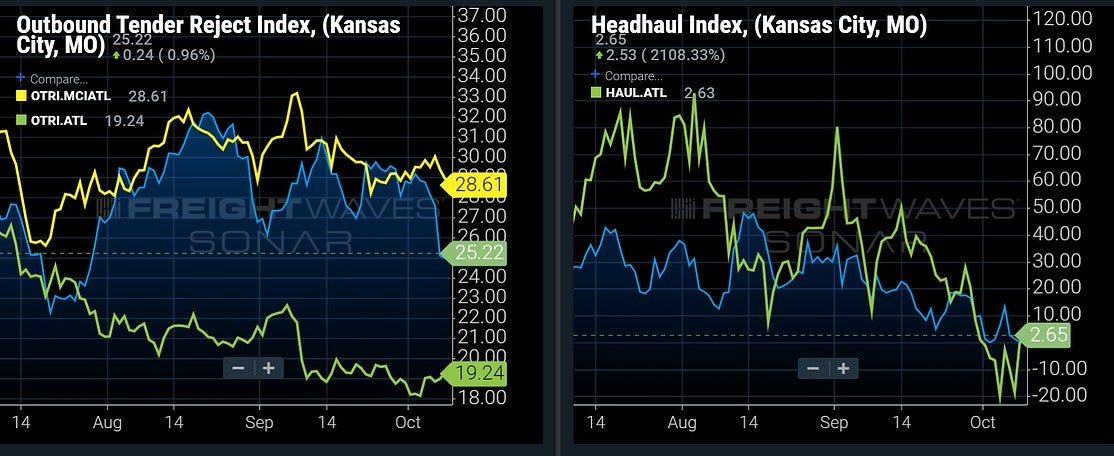
KANSAS CITY (Missouri) to ATLANTA: Rejection rates fall off a cliff out of Kansas City.
Highlights
- Kansas City’s outbound rejection rate has fallen from 29% to 25% over the past week, but it is still higher than the national average.
- Lane-specific rejection rates to Atlanta fell about a percent and a half over the same time, and are now well above the market average.
- The Atlanta market has stabilized quite a bit since the summer with an increase in inbound freight pushing rejection rates below 20% – where they appear to have found a floor for the moment.
What does this mean for you?
Brokers: Expect little change in rates in this lane this week. However, some slight easing may make it a little easier to cover contracted loads compared to last week. You will still need to pad margins for spot loads with less than a 2-day lead time.
Carriers: Expect a slightly better Atlanta market this week with a small percentage increase in load availability. This lane should still bring a decent margin due to continued limited availability around the origin, but you should not expect to get any significant rate increases on the spot market compared to last week
Shippers: Do not expect much change in this lane compared to last week. Limited availability will keep capacity constrained in Kansas City, but you may be able to see a slight difference in compliance. Over one-quarter of the loads are being rejected in this lane.
Shipper and carrier updates
Lead Economist Anthony Smith and Donnie Gilbert, director of customer solutions at FreightWaves, look at job openings and what to expect in the coming week in the Shipper Update.
Gilbert and Smith take a look at reefer rejection rates in the Carrier Update presented by PowerFleet.
Riding the wave
By Michael Vincent
Freight levels ride on waves. Literally and figuratively.
Predicting these “waves,” or at the least understanding their influences on the various modes of capacity, WAS an insight for strategic decision making. NOW it is essential to survival.
See right-hand chart below. These are booked TEUs (dotted line is the future) vs. OTR load tender volumes in green. Truckload lags a bit from maritime.
The left and center charts are showing you the reaction of the capacity and volumes of various lengths of haul from the Ontario, California, market.

SONAR notes
The Outbound Tender Volume Index (OTVI), shippers’ requests for capacity, erased last week’s positive momentum as tender volumes slid. OTVI has dipped back below the 16,000 mark, pulling back by 1.5% week-over-week (w/w). As it stands now, absolute tender levels are up just 2% year-over-year (y/y). …
Increased import demand compared to a year ago is setting up freight volumes to continue to climb through the rest of the fourth quarter. Import shipments have consistently held on to peak-season levels throughout the entire year, and ocean bookings from China destined for U.S. ports set a new all-time high just a couple of weeks ago. …
The Chicago freight market has been one of the most volatile in the country, especially compared to the other large freight markets. After freight volumes were down over 3% last week, that reversed course this week as freight volumes grew by 11.7% w/w. …
Reefer rejection rates were the most stable of the equipment types over the past week, falling just 3 bps w/w … Relative dry van capacity loosened pretty significantly over the past week as VOTRI fell by 81 bps w/w. … The flatbed market is showing signs of life as rejection rates take another leg up. The Flatbed Outbound Tender Reject Index (FOTRI) jumped almost 500 bps in the past week, reaching the highest point since late June. …
The national spot rate continues to climb through freight demand, and rejection rates suffered a slight pullback. That further signals that freight could be moving into the spot market, bypassing the contract market.
This week’s SONAR training webinars
Make sure to sign up and join us if you’re new to SONAR, need refresher training, or want to learn more about recently launched data sets. Register for any of our SONAR 101, 201, and 301 webinars hosted by our Customer Success team and Market Experts. Each webinar will include an interactive participant Q&A.
- SONAR 101: On Tuesday at 3:30 p.m. ET, watch our LIVE webinar and Q and A hosted by our customer success team, learn the basics of navigating SONAR’s widgets, tools, and view pages that drive immediate value.
- SONAR 201: On Wednesday at 3:30 p.m. ET, learn about SONAR’s most frequently used data sets and how you can apply them to your daily operations
- SONAR 301: On Thursday at 11:00 a.m. ET, hear from a rotating cast of market experts as they cover specialty and newly released data sets each week.
Supply Chain AI Symposium
Past the hype. Join operators, founders, and enterprise leaders figuring out how to deploy AI in supply chain.
F3: Future of Freight Festival
Industry-defining keynotes, rapid-fire technology demos, and industry leaders networking in experiences across Chattanooga - plus the inaugural F3 Awards Dinner featuring the FreightTech and Shipper of Choice reveals.
Past the hype. Join operators, founders, and enterprise leaders figuring out how to deploy AI in supply chain.
The Old Post • Chicago, IL Register NowIndustry-defining keynotes, rapid-fire technology demos, and industry leaders networking in experiences across Chattanooga - plus the inaugural F3 Awards Dinner featuring the FreightTech and Shipper of Choice reveals.
The Signal at Chattanooga Choo Choo • Chattanooga, TN Register Now