


Chart of the Week: National Truckload Index Forecast, National Truckload Index – USA SONAR: NTIF.USA, NTI.USA
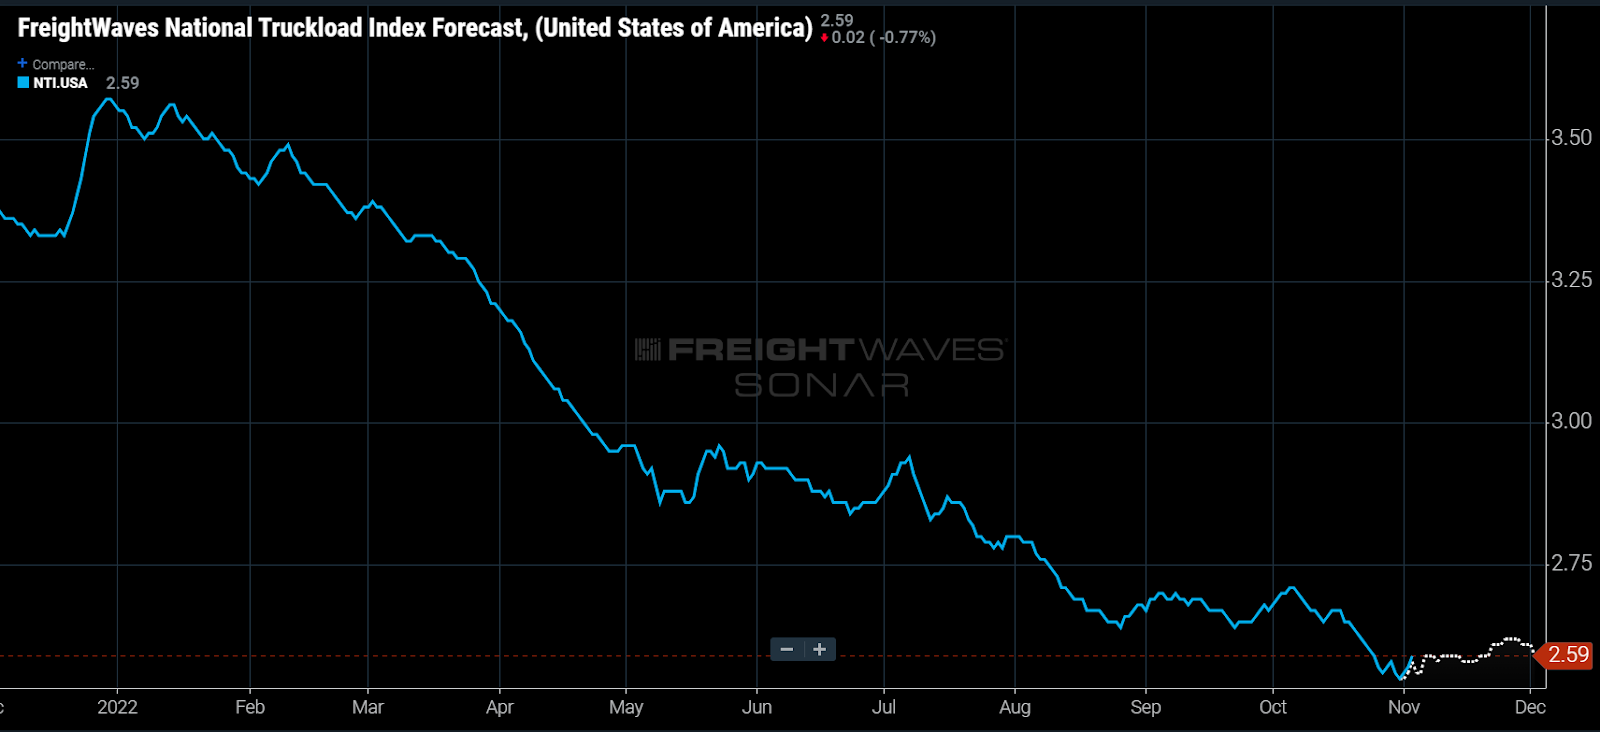
While many speculations around this year’s holiday shipping season — typically referred to as “peak” — remain muted, the newly released National Truckload Index Forecast (NTIF, the white dotted line) supports this expectation by showing a relatively flat trend in spot rates over the next 28 days.
The National Truckload Index (NTI) represents the average national spot rate for loads moving more than 250 miles. The NTIF is a projection of this index but is built on more than just historical rates with imports, wholesale fuel prices and contract rate data also being a part of the calculation among others.
The direction and magnitude are more important than the nominal value, as it is indicative of truckload capacity fluctuations across the U.S. Increasing values indicate tighter capacity as shippers bid against each other. This year’s market has several data points that support a relatively loose environment to close the year.
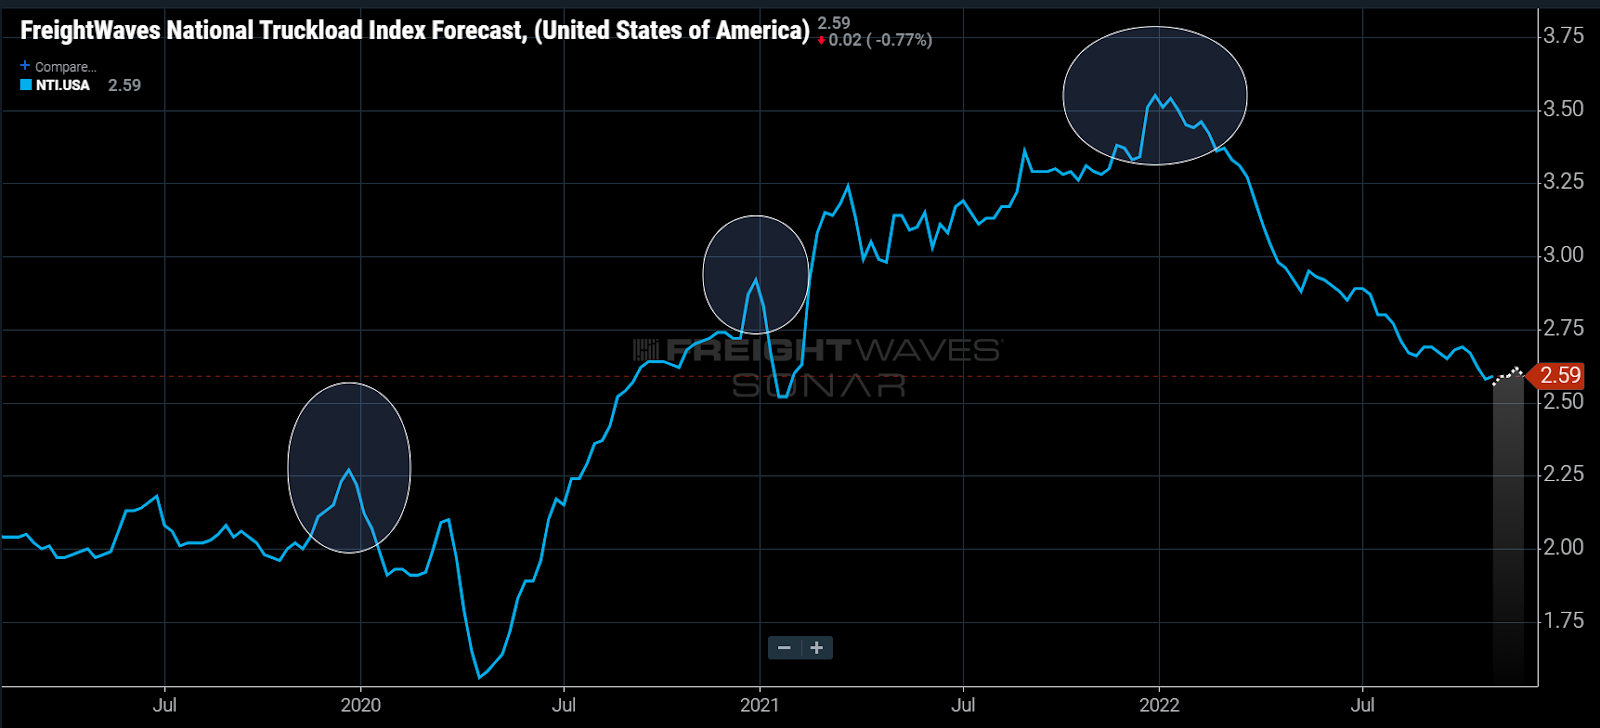
Peak season looks just like it sounds on the historical chart of the NTI with spot rates spiking by as much as 13% in 2019. The NTIF looks more like it is valuing the last six-month trend over historical holiday experiences.
Forecasts are naturally imperfect so it is important to know where some of the leanings are. Spot rates have not necessarily jumped around Thanksgiving in 2020 and 2021 the same way they did pre-pandemic. This may have an influence on keeping the forecast muted as the model weighs more recent holiday experiences more heavily.
The historical back testing shows a correlation of 85 (an extremely good result) and an average margin of error between 7 cents and 12 cents a mile from 15 to 30 days out, meaning that at worst, rates are still not expected to rise back to where they were in early October around Thanksgiving. So why is it so important to get this period right?
While the bulk of the yearly shipping occurs during the spring and summer months, the holiday season typically provides the highest margin opportunities for carriers and brokers and can make or break shipping budgets. This is due to a few factors and they aren’t exactly what you might think.
Urgency
Shipping service requirements change. Retail shippers have an increased sense of urgency as they respond more quickly to consumer demand. Demand forecasts are tricky around the holidays as gift buying trends are a lot like TikTok videos in the way you never know what will go viral. Shippers have to be ready to pounce when their items become the hot commodity.
Driver downtime
Capacity is dramatically reduced. Drivers take more vacation time around Thanksgiving and Christmas than any other holidays, just like the rest of the U.S. population. This not only means they have less availability around their vacations, but it also limits their coverage around their time off.
Fleet managers can’t send their driver who lives in Florida to California the week before they have home time. They will put boundaries around where they send them to make sure they are in a position to make it home in time.
Demand spikes can be a thing, but most shippers try to get everything positioned closer to the consumer in the months leading up to November and December. This is why we typically see maritime and rail shipping volumes peak from August into October — a trend that has been somewhat hard to identify during the pandemic.
Much of the demand-side influence on the spot market comes from expedited or guaranteed service shipments during the holidays.
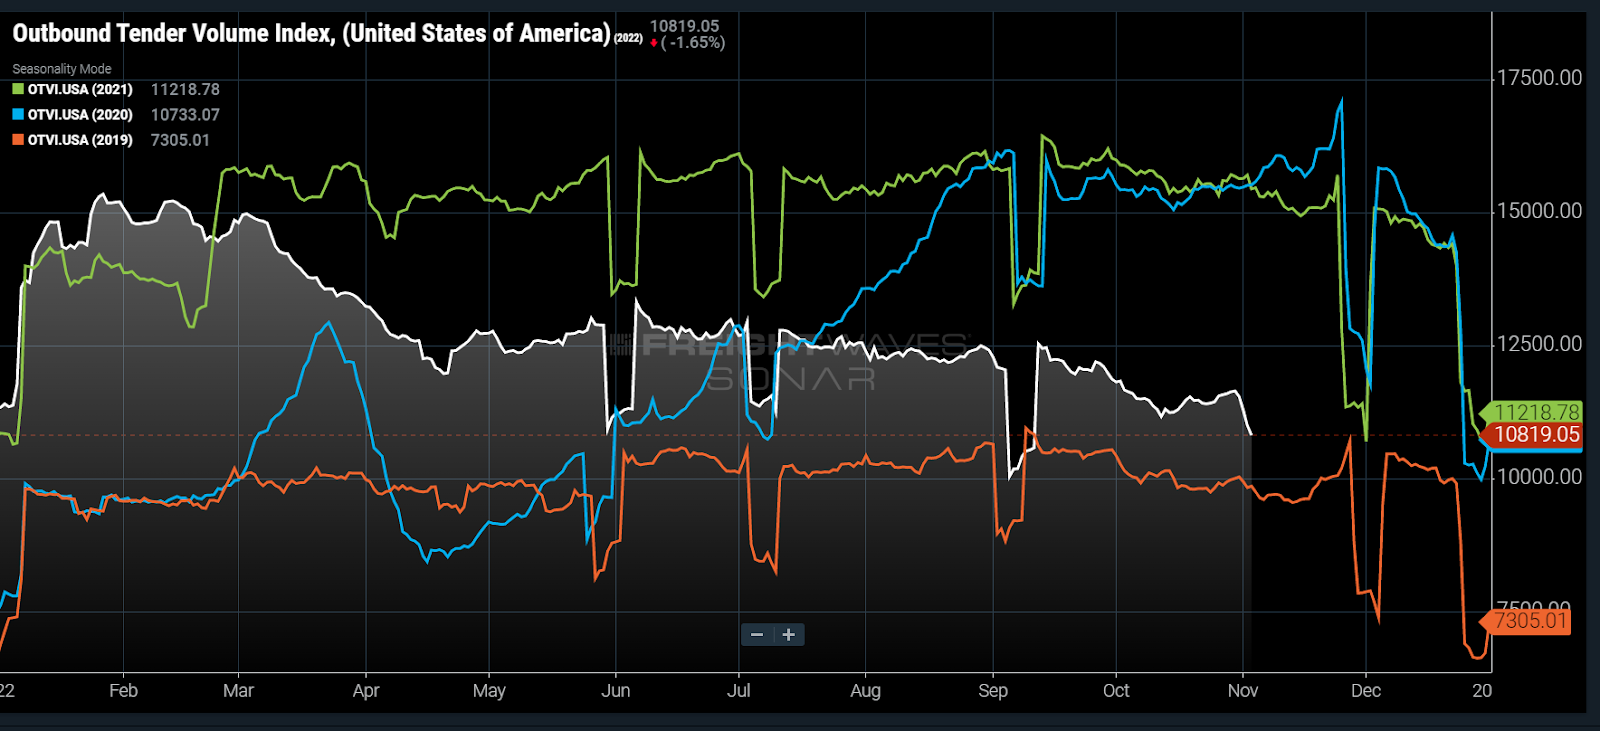
The national Outbound Tender Volume Index (OTVI) — a measure of domestic truckload demand — dropped 7% to start the month. While this is seasonal to an extent, this level of decline is alarming and also supportive of a market that will have ample capacity if demand does increase later this month.
While the forecast for a muted peak season may not be very surprising, it is yet another validation point for anyone trying to wrap their heads around what to expect in one of the most important times of the year for shipping.
About the Chart of the Week
The FreightWaves Chart of the Week is a chart selection from SONAR that provides an interesting data point to describe the state of the freight markets. A chart is chosen from thousands of potential charts on SONAR to help participants visualize the freight market in real time. Each week a Market Expert will post a chart, along with commentary, live on the front page. After that, the Chart of the Week will be archived on FreightWaves.com for future reference.
SONAR aggregates data from hundreds of sources, presenting the data in charts and maps and providing commentary on what freight market experts want to know about the industry in real time.
The FreightWaves data science and product teams are releasing new datasets each week and enhancing the client experience.
To request a SONAR demo, click here.
