
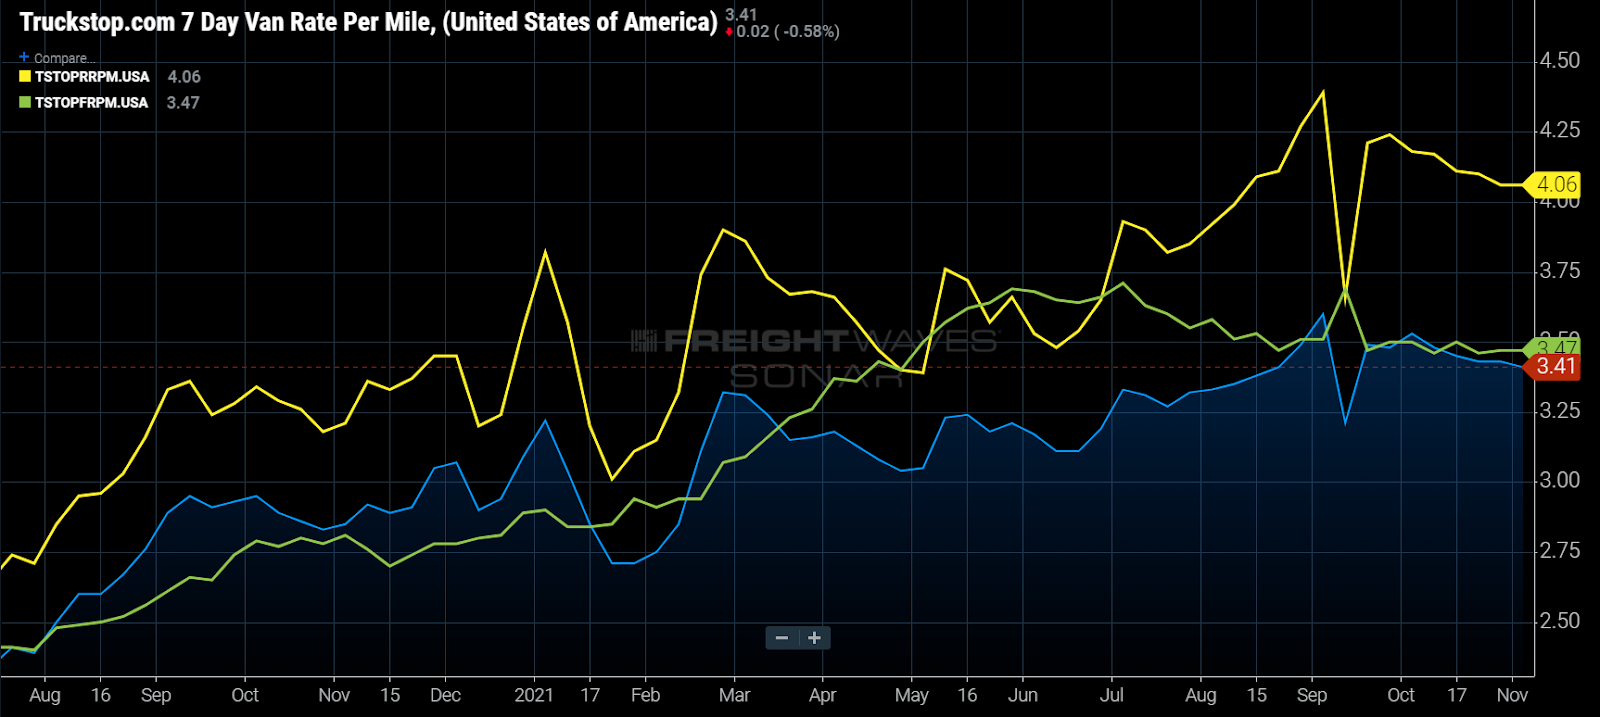
Chart of the Week: Truckstop.com Average Van/Reefer/Flatbed Rate per Mile – USA SONAR: TSTOPVRPM.USA, TSTOPRRPM.USA, TSTOPFRPM.USA
Truckload spot rates have been slowly declining since Labor Day for the three main equipment types of dry van, refrigerated (reefer) and flatbed loads. The declines have been nominal, with the all-inclusive rates falling the most (4%) for refrigerated loads and just over 1% for van and flatbed freight. As discussed in last week’s chart of the week, a rapid rise in fuel prices may be masking a more severe decline. Has the market peaked before the traditional peak?
Looking at tender volumes, there has been little to no significant change in the demand for freight over the past eight months. Removing the rejected tenders from the national index actually shows a slight increase (0.09%) in accepted volumes since Sept. 1, meaning more freight is moving under contracted rates.
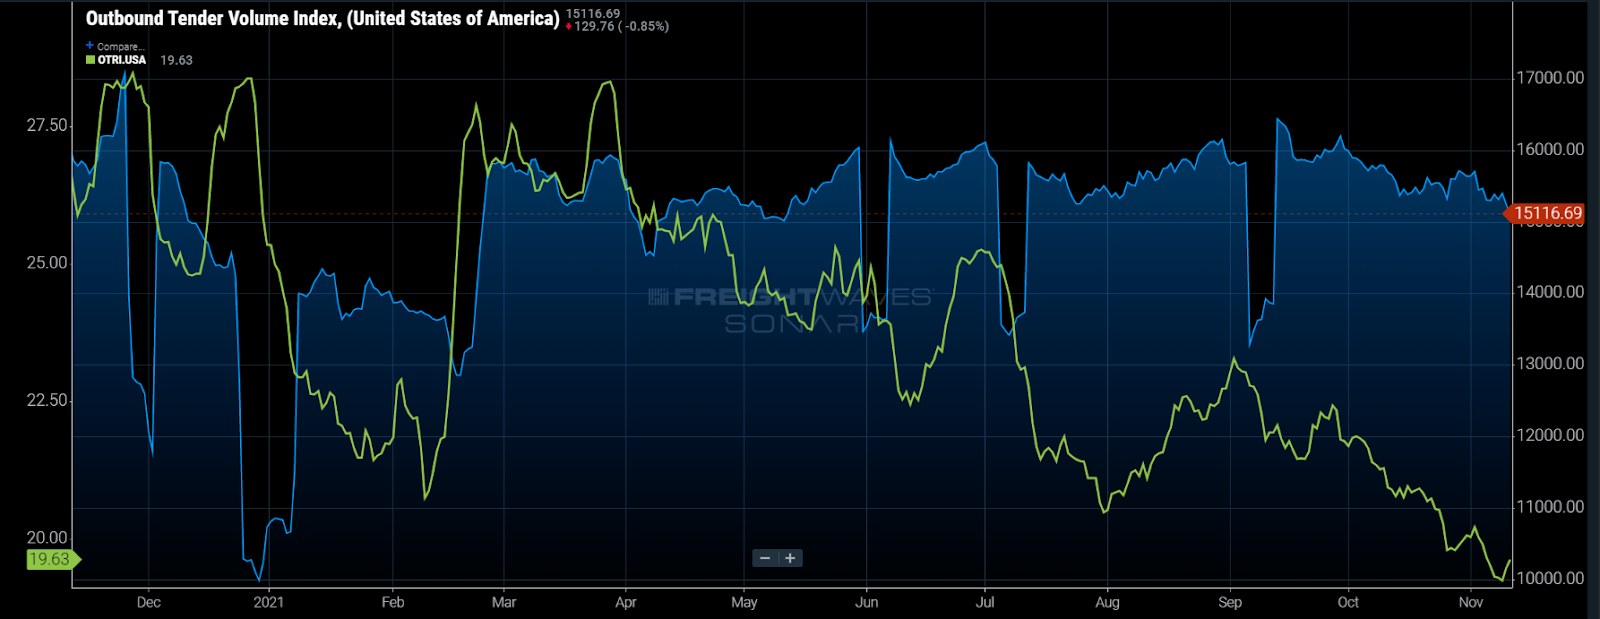
With more loads moving under contract, less freight falls to the spot market, which pushes carriers to lower their rates in situations they were counting on transactional freight being available in order to keep their trucks moving. The key takeaway here is that demand has remained consistent, with shippers spending less on the spot market but more on the contracted side over the past month.
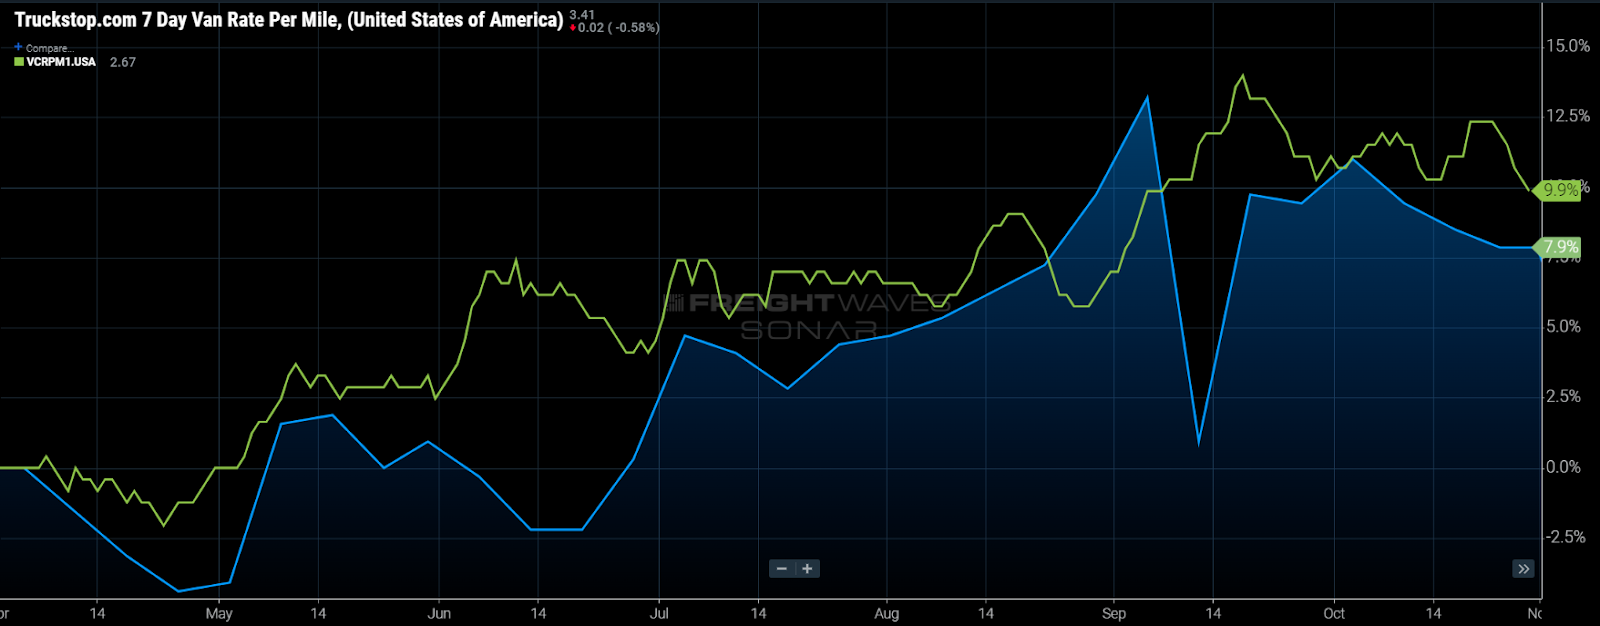
Up till this point contract rate increases have done little to mitigate rising spot rates. Looking at van contract rates, several shippers took large increases around Labor Day, which has slowed spot rate growth substantially. The big question is just how these contract rate increases will impact the upcoming holiday shipping season.
The one historical seasonal pattern that has persisted over the past year has been spot rates increasing right around or leading up to the six main national holidays. This jump in rates is largely due to temporary supply side contractions as drivers come off the road.
The pattern of holiday spot rate increases is undeniable and will without fail occur around Thanksgiving and Christmas as more drivers take this time off than any other and service requirements increase dramatically from the shipper perspective. Not all lanes will be as sensitive to this effect, however.
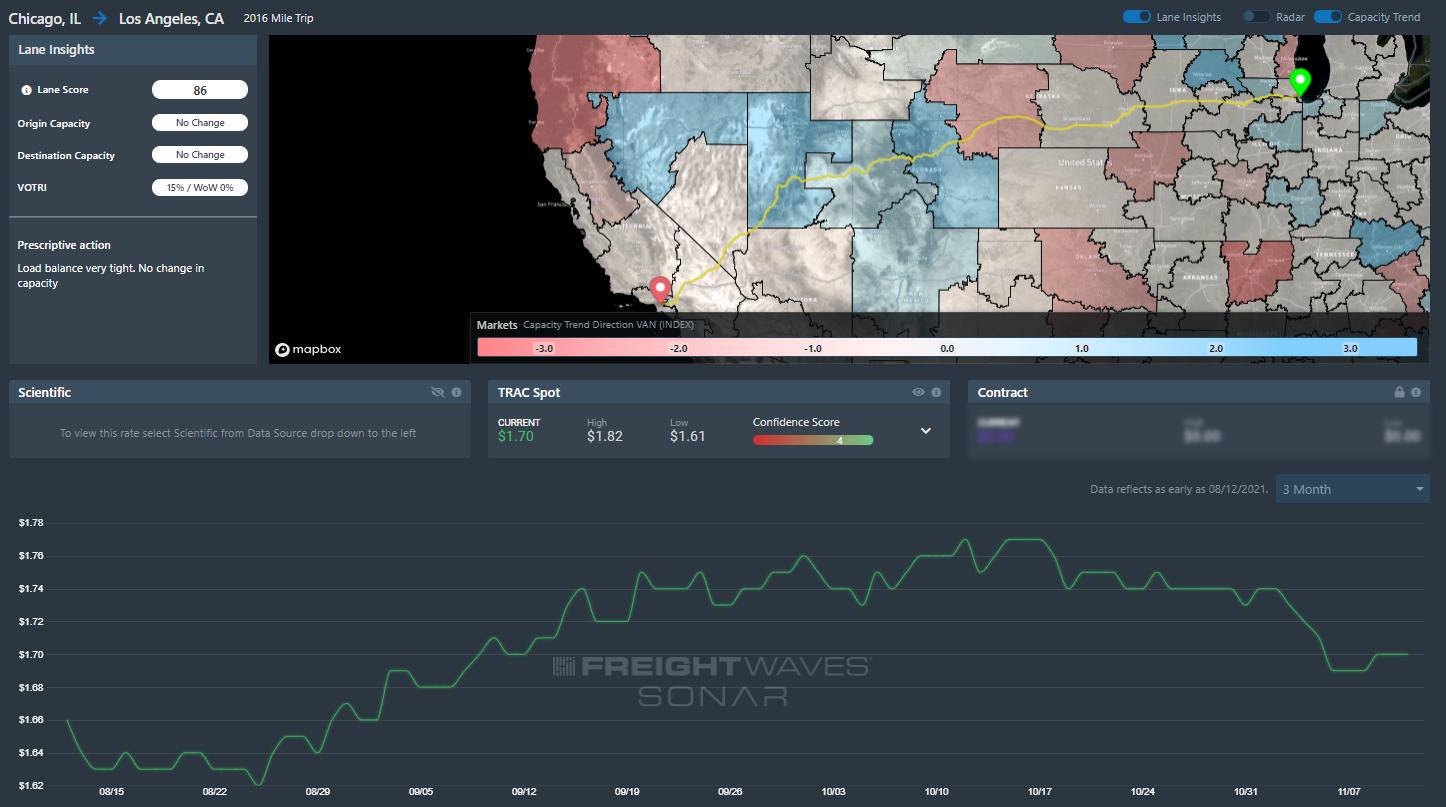
Looking at FreightWaves TRAC rates inside its newly released Market Dashboard tool, rates from Chicago to Los Angeles peaked right around $1.77 per mile in the middle of October and have been falling since.

Rates have continued to climb for loads moving in the opposite direction and at a much higher rate, currently $3.49 per mile. Even though aggregate rates have fallen, loads moving from highly imbalanced areas are still upward pressure on rates.
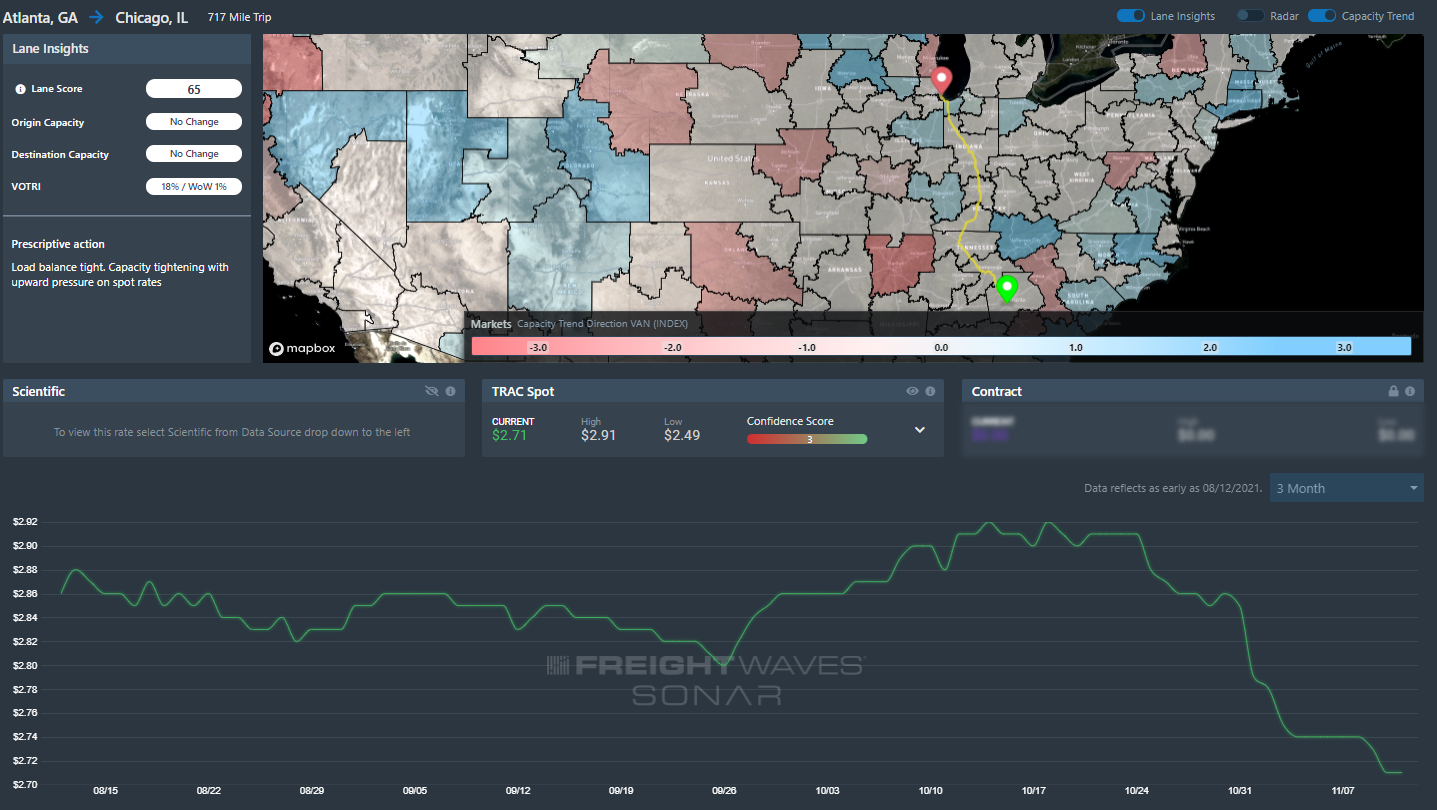
Contract rates appear to have had a strong impact on relatively balanced lanes like Atlanta to Chicago, where capacity and demand conditions are similar at both ends. Spot rates have fallen 20 cents per mile since Oct. 24.
The decline in spot rates may be somewhat surprising in the current environment, but it is not a sign that this holiday season will be a soft one. The market continues to have serious imbalances and the invisible hand of contract rate increases is providing a floor for any subsequent price easing that may occur after the holidays.
About the Chart of the Week
The FreightWaves Chart of the Week is a chart selection from SONAR that provides an interesting data point to describe the state of the freight markets. A chart is chosen from thousands of potential charts on SONAR to help participants visualize the freight market in real time. Each week a Market Expert will post a chart, along with commentary, live on the front page. After that, the Chart of the Week will be archived on FreightWaves.com for future reference.
SONAR aggregates data from hundreds of sources, presenting the data in charts and maps and providing commentary on what freight market experts want to know about the industry in real time.
The FreightWaves data science and product teams are releasing new data sets each week and enhancing the client experience.
To request a SONAR demo, click here.