
FreightWaves data scientists are sifting through vast quantities of GPS data from trucks to better understand freight flows in the United States, and recently completed a study of the Ports of Los Angeles and Long Beach. We wanted to know more about the origins and destinations of trucks that move container freight out of the ports; we were also curious to find out how quickly a container box can make its way into a retailer’s network of distribution centers.
Our data set included tens of thousands of GPS pings from the first half of 2018 in the ports themselves, and we followed those devices to see where the trucks went in the first 48 hours after leaving the port. We found that fully 83% of the trucks associated with port activity remained in Southern California over the next two days, many of them headed east of Los Angeles to the Ontario market, where real estate is somewhat less expensive and distribution centers are more plentiful.
At the distribution centers, the containers are opened and the freight is broken apart. This is actually a fairly labor intensive process, since a shipper, for example a big box retailer, might not know what exactly is in each of its containers as they come in. So the freight is taken out and inspected, and in some cases repackaged (some forms of apparel may be re-boxed or re-bagged, for instance). Then workers in the distribution centers build pallets out of the formerly containerized freight and put them on LTL trucks for their linehauls to smaller hubs or even retail locations.
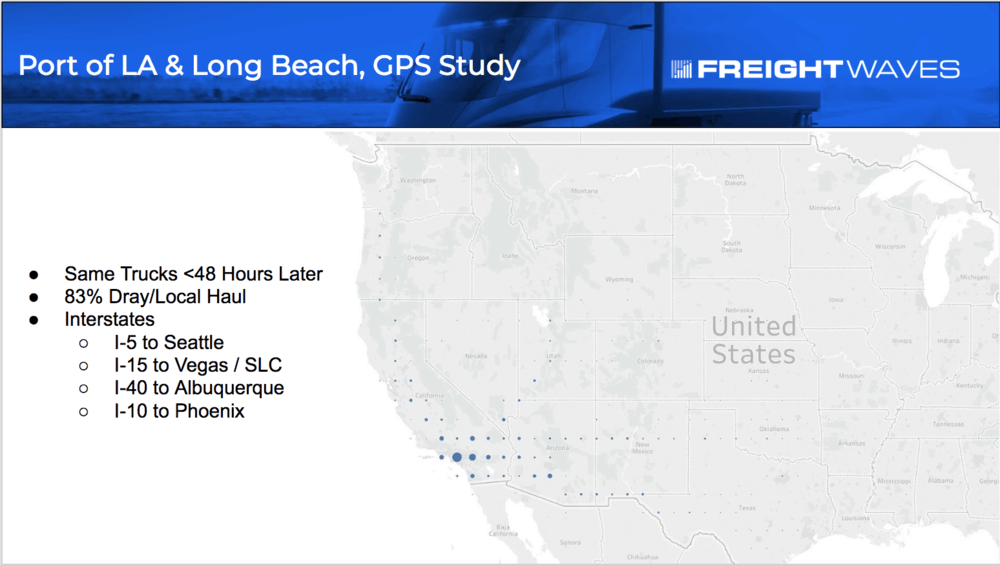
Even though 83% of the truck activity at the ports is drayage and local haul that never really leaves the Los Angeles and Ontario markets, almost a fifth of the freight hits the interstate to move further into distribution networks. Coming out of the ports (we lumped Los Angeles and Long Beach together for the purposes of this study), trucks went up I-5 to Seattle, I-15 to Las Vegas and Salt Lake City, I-40 to Albuquerque, and I-10 to Phoenix. The map below shows where the port trucks were located 48 hours after they left the dock, including the dray and local haul tractors.
Zooming into Phoenix, 385 miles later and 48 hours after the trucks left the ports in California, we see most of them at truck stops along I-5, but a number of them are already bumping docks at distribution. The heat map below shows where in Phoenix the port trucks’ GPS pinged.

Ultimately, we want to be able to assess the efficiency of freight networks in the United States, help shippers understand which of their facilities are clogging their supply chains, and provide carriers entering contract freight negotiations better information about the costs they may incur in moving freight for specific shippers on specific lanes. We’re excited about the early results from our data team, and we’ll keep reporting our findings as develop an even more granular picture of freight flows in the United States.
Stay up-to-date with the latest commentary and insights on FreightTech and the impact to the markets by subscribing.