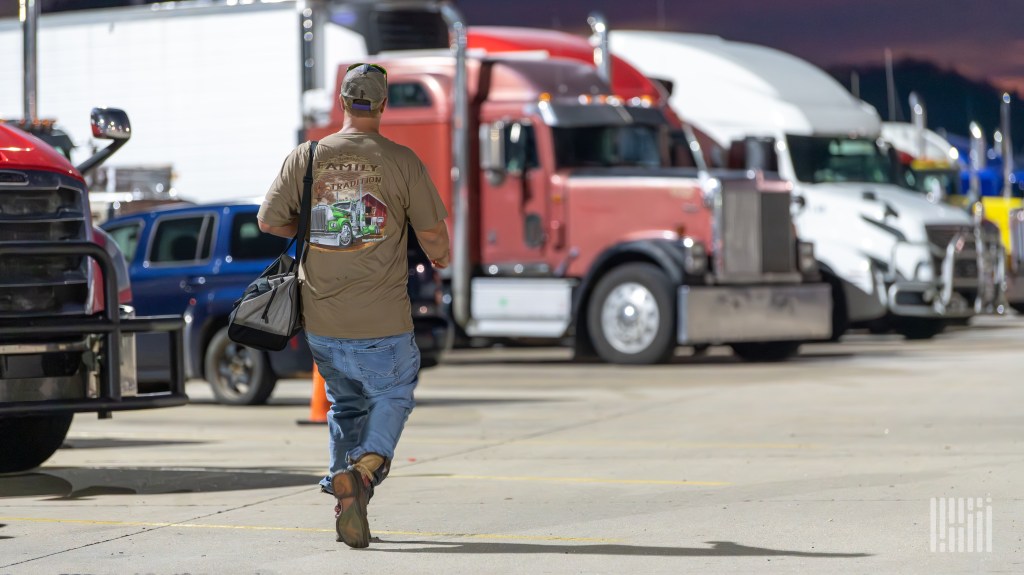
The ‘ingenious strategy’ behind most truckers’ least favorite week of the year: International Roadcheck

truck fallen over

International Roadcheck Week is hardly the sexiest topic in trucking, but it is a darn-tootin’ important one. Inspectors in the U.S. and Canada halt tens of thousands of trucks for vehicle inspections for a few days every summer or early fall. They remove thousands of trucks and drivers from the road; in 2021, 16.5% of inspected vehicles were put out of service along with 5.3% of drivers.

It’s uncommon for truck drivers to actually get their vehicles inspected at random during most of the year. To avoid International Roadcheck Week, many truckers simply don’t drive during that period of time — which, presumably, means more unsafe vehicles and drivers on the road outside of the inspection blitz. It’s a question that ate at Andrew Balthrop, a research associate at the University of Arkansas Sam M. Walton College of Business. 

Around 5% fewer one-person trucking companies are active during International Roadcheck Week. But Balthrop and his fellow researcher, Alex Scott of the University of Tennessee, found a major upside to the inspection blitz — even with all the folks who avoid it. According to their working paper published in March 2021, vehicles are safer a month before and after the inspection period. There’s a 1.8% reduction of vehicle violations, according to Balthrop and Scott’s analysis. Surprise inspection blitzes don’t result in the same uptick of compliance. 

I caught up with Balthrop about his research last week at FreightWaves’ Future of Supply Chain conference, and we chatted again on the phone this week about his findings on International Roadcheck Week.

Enjoy a bonus MODES and a lightly edited transcription of our phone interview: 

FREIGHTWAVES: For our readers who are not aware of what Roadcheck Week actually is, can you explain a little bit about what it and why it is important to drivers and companies?

BALTHROP: “The International Roadcheck is part of an alliance between the inspectors in Canada and the ones in Mexico and the U.S. to have a unified framework for making sure trucks are safe to operate. That should make it easier to go across borders when you have this kind of unified structure.

“In the U.S., one of these CVSA inspection blitzes is the International Roadcheck that happens for three days in the summer. Usually it’s a Tuesday, Wednesday and Thursday. And usually it’s the first week in June.

“And in it, they focus on Level One inspections, the North American Standard Inspection where they inspect the driver records, the hours of service, the licensure and I believe medical records as well. Then they inspect the truck. It’s an in-depth inspection where the inspector will actually crawl under the truck to look at various things. And these inspections, from the data that I’ve seen, take about a half an hour on average.

“During the Roadcheck Week, they’ll do about 60,000 inspections, so 20,000 a day. They’re going to pull over a lot of trucks, and this can cause a little bit of congestion at the weigh stations and the roadside inspections localities as the inspectors are doing these inspections.”

Roadcheck Week doesn’t catch all truck drivers, but it has a long-lasting benefit to safety

FREIGHTWAVES: So, can most drivers kind of expect to be pulled over? How likely is that?

BALTHROP: “There’s 1 million or 3 million trucks on the road, somewhere around there on any given day. With 20,000 inspections, most drivers still will not get inspected, but there’s going to be a higher proportion of drivers inspected. 

“You’re more likely to get inspected on these days. If you don’t have a recent inspection on your record, or if you have a bad recent inspection on your record, you’re more likely to be pulled over on these days.”

FREIGHTWAVES: Your research focused on that it’s just unusual that this inspection is announced, that it’s planned. We were talking before about how normally, if you’re trying to assure quality or compliance, you would not announce an inspection in advance. It would be more of a surprise-type situation. 

Can you walk us through why that’s so unusual, or what’s the rationale that you see behind announcing it in advance?

BALTHROP: “It is unusual, and on the surface, it doesn’t make much sense, but it turns out to be kind of an ingenious strategy. So I’ll walk through it here. 

“Over the course of a year, there’ll be 2 million inspections of 3 or 4 million trucks out there. The average rate of inspections is pretty low. It’s not uncommon for truckers to go years without having an inspection. With this low inspection intensity, the FMCSA has sort of a problem of, how does it get anybody to abide by the regulations?

“I’m a jaded economist, and I don’t worry or consider too much ethics and morality and all that kind of stuff. It comes down to incentives for drivers to follow these inspections. The incentives do guide behavior. So, how could the FMCSA incentivize drivers to follow these regulations more closely and adhere to the standards?

“They do this by announcing the blitz. This does two things. On one side, it allows everybody to prepare in advance. There’s a bunch of anecdotal evidence out there that people do prepare for these blitzes in advance. They will have their trucks inspected beforehand for any problems. They’ll time maintenance and upkeep in advance to make sure that their vehicles are in order. “They’ll be a little bit more cognizant of the driver-side regulations. One thing we notice in our study is that hours-of-service violations really drop during these extensions, because people see them coming. They don’t fudge the books in any way.”

Owner-operators can evade Roadcheck Week. Big carriers, not so much.

BALTHROP: “The issue with the announcement, on the flip side, is that it allows people to just dodge the inspection entirely. For a long time, people have talked about how owner-operators and smaller carriers time their vacations for this particular time. They could do this for a couple reasons. To avoid the hassle is a nice way to put it, but it also allows you to be noncompliant to avoid the high-intensity inspections.

“You have this balance here that on one side you get the behavior you want with people complying with regulations. That’s the behavior the FMCSA wants. But on the flip side, you get a bunch of people that are kind of outright dodging inspections.

“When you compare these two things on balance, the policy is actually pretty effective because you get a lot of people focused on maintaining their trucks and obeying the rules during that particular week. Especially with the vehicle maintenance stuff, that lasts a long time. 

“In our research, we saw that vehicle violations, a month before and up to a month afterwards, is when you still notice your vehicle violations. That trucks are kind of better maintained around these blitzes.

“The ingenious aspect of it is that the FMCSA, by concentrating their inspection resources all at one time and announcing it, they’re making it clear that they’re serious about enforcing these regulations and everybody prepares for it. For the number of inspections that are happening, you get fewer tickets than you would have otherwise expected.

“The FMCSA, they’re putting people through a little bit of a hassle, but they’re not having to write a bunch of tickets to get people to comply. They’re not really punishing a whole bunch of people because, by making this apparent that this is going to happen, people comply and the FMCSA gets what they want essentially without having to come down on carriers too hard.”

A convenient time for a vacation, indeed

FREIGHTWAVES: OK, interesting. And how does this pattern of shutting down, how does that compare for an owner-operator versus a driver for a big fleet?

BALTHROP: “If you’re a motor carrier with thousands of power units, you can’t just pack up and not do business on a particular day. They just don’t have that option. So they get inspected at a higher intensity, and you see the larger carriers kind of more focused on making sure that they’re prepared for these inspections. With so many inspections, the larger carriers are going to be inspected at higher rates. You can really damage your reputation if your equipment isn’t in order on this particular day. 

“Versus the smaller carriers, especially if you’re talking about a single-vehicle fleet, an owner-operator type, it is not that difficult to just not work for those three days. And so you see a lot about that. 

“In terms of what the roadway composition looks like, if we look at inspection data and relative to a typical day with the usual inspections, on these Roadcheck days, you have about 5% fewer owner-operators on the road than you otherwise would expect.”

FREIGHTWAVES: Wow. And when you say owner-operators, you also mean just like fleets with just —

BALTHROP: “One-vehicle fleets.”

FREIGHTWAVES: OK, that’s interesting.

BALTHROP: “You know, you see a little bit of effect with the smaller fleets, below six vehicles, but it basically disappears by the time you get to a hundred vehicles.

“This effect is being driven by smaller carriers staying off the road in terms of avoidance. You see this goes also how you would expect; it’s also older vehicles that stay off the road. This is correlated with carrier size. The larger carriers use newer vehicles and owner-operators tend to use some of the older vehicles. But it’s particularly the older vehicles that are off the road.

“This makes intuitive sense. Older vehicles are more costly to keep compliant. Maintenance is more costly, and they’ve been around longer so there’s time for more stuff to have broken essentially.

How a truck driver gets stopped for inspection

FREIGHTWAVES: Can you explain a little bit more, the idea of having this inspection history and why it would benefit a larger or small carrier?

BALTHROP: “Getting flagged for inspection is sort of random, but not totally. If somebody notices something obviously wrong with your truck, that’s ground for a more in-depth inspection. Or if you get pulled over for some other reason, this can be grounds for inspection of some type. 

“But there’s also the inspection selection service. The computer program that is random, that it randomly flags people in for inspection, but it’s based on your inspection history.

“So if your firm hasn’t been inspected recently, or if your carrier doesn’t have a very dense inspection history, you’ll be more likely to trigger that system to pull you in and have you inspected. If you have a dense inspection history, you’re less likely to get inspected.”

FREIGHTWAVES: So how do you get pulled over for inspection? As a person who only drives a passenger car, my main interaction with being pulled over is, I’m driving down the freeway or wherever, and I get stopped by the police. How does it work for a truck driver? How does getting pulled over or inspected work in that way?

BALTHROP: “The law is that you cannot pass a weigh station without pulling in and getting weighed. At that point they may flag you to be inspected. Now, in the past decade or two, there’s been a bunch of electronic devices that are installed in cabs. You may have heard of PrePass or Drivewise. This allows you to pass weigh stations. 

“I don’t have data on how many trucks have the in-cab devices. But from a trucking perspective, they’re so convenient that you don’t have to stop every time you cross a state line. I think the vast, overwhelming majority of trucks have some sort of one of these electronic devices. The DOT inspectors at these roadside inspection points have a dial they can twist essentially about how many people they want to inspect. 

“So during the roadcheck inspection week, they’ll crank that dial all the way up and pull everybody over. And if they get too backed up, they might crank it back down a little bit and so on.”

FREIGHTWAVES: OK, interesting. It reminds me of a highly sophisticated E‑ZPass.

A $10 million-plus expense to trucking companies every year … but it’s worth it if just one fatal crash is avoided

FREIGHTWAVES: Zooming out, when we hear about large truck crashes, something like a vehicle maintenance issue is not really the most sexy explanation. But just looking at the FMCSA data, in 29% of all truck crashes, a major factor is brake problems. So it seems like a lot of the truck crashes on the road are caused by vehicle maintenance, versus something like the driver using illegal drugs or some other sort of more dramatic explanation. Can you speak a little bit to why this sort of vehicle maintenance is important for safety in preventing large crashes?

BALTHROP: “We did a little bit of a back-of-the-envelope cost benefit analysis of this. Let me try and make sure I remember it clearly, but we have it in the paper that the cost of this on one side is that you have the compliance costs the firms are undertaking, and then you have to add to that the delay costs from doing this, and then the cost of the inspection itself, having to pay federal inspectors to do this.

“On the benefit side, it reduces crashes. So when we add up, just looking at the cost of what an inspection is, we don’t have a good idea of how to measure the compliance cost. It’d be fun to measure the delay cost, but I don’t have good enough price data on that to get at that cost. 

“But if you look at what the cost of an inspection is, it is something like $100 or $120 is what you would pay to have one of these inspections done privately. A lot of people do this in the run-up to inspections, and have it done privately so that you can fix whatever the problems are and be sure that you would pass the FMCSA inspection.

“With that $120 figure, if you aggregate that up to 60,000 inspections or whatever, and you take that in comparison, I’m going to give you a bad figure here, it’s on the order of $10 million. That is about the value of a statistical human life. Looking at this economically, it’s worthwhile if it saves one human life. If you identify just one faulty brake system that would’ve resulted in an accident, you’re getting some value out of the program. 

“When you add those other costs in there, we’re going to need to save a couple of lives, but in terms of cost benefit analysis with this kind of stuff, we’re usually looking at orders of magnitude differences in cost and benefits to say something for sure. 

“If you can save just a couple lives, this program will pay for itself.”

Time to start inspecting in the winter

FREIGHTWAVES: Then one last question: Is there any rationale for this program happening in the summer? 

BALTHROP: “I think part of it is that for the inspectors this gets much harder and much more miserable to do in winter conditions.”

FREIGHTWAVES: That makes sense.

BALTHROP: “Inspectors are less productive. One of the things that we talk about in the paper, that they have in addition to the International Roadcheck, is that they have Brake Week where they focus a little bit more on brake inspections. You have Operation Safe Driver a little bit later on in the summer, usually in September, where it’s a little bit more focused on passenger vehicles and how they drive around these trucks.

“But there’s not one in the winter time. There’s an unannounced brake check that usually happens in May, a surprise inspection that’s just one day. But you’re right in pointing out that it might be worthwhile having one of these in the wintertime. You have this periodic high-intensity inspection that kind of incentivizes everybody to be compliant through the summer. 

“But there’s nothing in the winter, so that’s an area. But if I was managing the FMCSA, that would be one of the first questions I ask, ‘Why don’t we have one of these in the wintertime?’”

FREIGHTWAVES: That makes sense. Maybe they can do it in the South or something. Maybe a Miami January inspection … 

That’s it for this special bonus MODES. Subscribe here if you’re not already receiving MODES in your inbox every Thursday. Email the reporter at rpremack@www.freightwaves.com with your own tales on International Roadcheck Week or any other trucking topics. 

Why the Northeast is quietly running out of diesel

The nozzle of a diesel fuel pump is inserted into the tank of a commercial truck as its driver looks on the bankground.

The East Coast of the U.S. is reporting its lowest seasonal diesel inventory on record. And some trucking companies appear spooked.

The East Coast typically stores around 62 million barrels of diesel during the month of May, according to Department of Energy data. But as of last Friday, that region of the U.S. is reporting under 52 million barrels. 

The sharp increase of diesel prices has been a major stressor in America’s $800 billion trucking industry since the beginning of 2022. According to DOE figures, the price per gallon of diesel has reached record highs — a whopping $5.62 per gallon. It’s even higher on the East Coast at $5.90, up 63% from the beginning of this year. 

When relief is coming isn’t yet clear, and experts say higher prices are the only way to attract more diesel into the Northeast.

“I wish I had some good news for the Northeast, but it’s bedlam,” Tom Kloza, global head of energy analysis at OPIS, told FreightWaves. 

2022 has seen record-setting diesel prices. (SONAR)

Everyday Americans don’t fill up their cars with diesel, but the fuel powers our nation’s agriculture, industrial and transportation networks. More expensive diesel means the price of everything is liable to increase. Trucks, trains, barges and the like consumed about 122 million gallons of diesel per day in 2020

Patrick DeHaan, a vice president of communications at fuel price site GasBuddy, reported that retail truck stops are hauling fuel from the Great Lakes to the Northeast, calling it “extraordinary.” We’ve also seen anecdotal reports from truck drivers posting company memos:

Pilot Flying J and Love’s, two of America’s largest truck stops, told the Wall Street Journal yesterday that they were not planning to restrict diesel purchases, but were monitoring low diesel inventory.

Not unlike every other supply chain crunch we’ve seen in the past few years, the cause of the Northeast’s diesel shortage is multifaceted. A yearslong degradation of refineries is rubbing against the Gulf Coast preferring to ship its oil to Europe and Latin America.

Here’s a breakdown:

1. The East Coast has lost half of its refineries. 

As Bloomberg’s Javier Blas wrote on May 4 (emphasis ours): 

In the past 15 years, the number of refineries on the U.S. East Coast has halved to just seven. The closures have reduced the region’s oil processing capacity to just 818,000 barrels per day, down from 1.64 million barrels per day in 2009. Regional oil demand, however, is stronger.

Rory Johnston, a managing director at Toronto-based research firm Price Street and writer of the newsletter Commodity Context, told FreightWaves that refining is a “thankless industry,” with intense regulations that have limited the opening of new refineries. The Great Recession of 2008 led to several East Coast refineries shuttering, but there have been more recent shutdowns too. One major Philadelphia refinery shuttered in 2019 after a giant fire (and it already had declared bankruptcy), and another refinery in Newfoundland shut down in 2020.

2. It’s a financial risk to bring diesel to the Northeast.

The Northeast has increasingly relied on diesel from the Gulf region. Much of that diesel travels to the Northeast through the famous and much-adored Colonial Pipeline. You may remember the 5,500-mile pipeline from last year, when a ransomware attack shuttered it for nearly a week!  

It takes 18 days for oil to travel on the Colonial Pipeline from its source in Houston to New York City (or, more specifically, Linden, New Jersey), Kloza said.

That’s a long enough time to prioritize Colonial pipelines financially risky for traders — or, as Kloza said, “incredibly dangerous” — thanks to a concept called “backwardation.”

Backwardation refers to the market condition in which the spot price of a commodity like diesel is higher than its futures price. It’s only gotten stronger over time in the diesel market, Kloza said. So, a company could send off a shipment of diesel and find that it dropped by $1 per gallon in the time the diesel traveled from the Gulf Coast to New York — er, New Jersey. That could mean hundreds of thousands or more in lost profits, so traders often avoid such a fate.

“We’re not in an era where there are any U.S. refiners or big U.S. oil companies who would ‘take one for the team’ and bring cargo in where it’s needed,” Kloza said. 

The desperation is showing in New England and the mid-Atlantic regions. New England diesel retail prices are up 75% from the beginning of 2022, per DOE data. In the mid-Atlantic, diesel is up 67%. 

It’s not worth the risk, even amid ultra-high prices. As FreightWaves’ Kingston reported last week, the spread between a gallon of diesel in the Gulf Coast and its New York harbor price is usually a few cents. Last week, that swung up to 66 cents.

But that uptick still isn’t justifying moving oil to the Northeast — particularly when traders can make so much more money selling diesel abroad. 

3. Of course, we can blame COVID and the crisis in Ukraine. 

The catalyst for this diesel shortage, of course, is the ongoing conflict in Ukraine — particularly Europe’s desperation for diesel after weaning off Russian molecules. 

As CNBC reported in March, Europe is a net importer of diesel. Europe consumed some 6.8 million barrels of diesel each day in 2019; Russia exported some 600,000 barrels per day of that. Today, Europe has only eliminated one-third of its Russian diesel, so prices are expected to continue to climb amid that transition. Latin America, too, has been clammoring for U.S. diesel.

The Gulf Coast has been happy to provide such diesel, amid “insane” prices for diesel abroad, said Johnston. Waterborne exports of diesel from the U.S. Gulf Coast hit record highs last month, according to oil analytics firm Vortexa. (The records only date back to 2016.)

Naturally, COVID is also to blame for the Northeast’s run on diesel. Those refineries still retained on the East Coast scaled back during the pandemic due to staffing issues. It takes six months to a year to reignite refineries that were previously shuttered, Kloza said.

The ‘everything shortage’ endures

It’s been a tale as old as, well, last year. An industry is quietly hampered by supply issues for years, or even decades, and COVID pulls back the curtains on its unsteady foundation. It’s particularly jarring for commodities we never thought about before, like shipping containers or pallets, but that quietly underpinned our livelihood all along. 

Recall the Great Lumber Shortage of 2020? Big Lumber had unusually low stockpiles of wood by the summer of 2020, thanks to a vicious 2019 in the lumber industry shuttering sawmills and the spring of 2020 sparking staffing issues. (There was also a nasty beetle infestation.) Those in lumber expected the pandemic to slow the economy, not ignite online shopping, construction and housing mania. It meant lumber went from around $350 per thousand board feet pre-pandemic to a crushing $1,515 by the spring of 2021. The lumber price roller coaster persists today.  

In diesel, there’s no beetle infestation, but there are plenty of other headaches. It all means higher fuel prices on the East Coast, particularly the Northeast, to lure molecules from the Gulf Coast. And, down the line, probably more expensive stuff for you. 

Do you work in the trucking industry? Do you want to say that you hate or love MODES? Are you simply wanting to chitchat? Email the author at rpremack@www.freightwaves.com, and don’t forget to subscribe to MODES.

Updated on May 13 with the latest comments from truck stops.

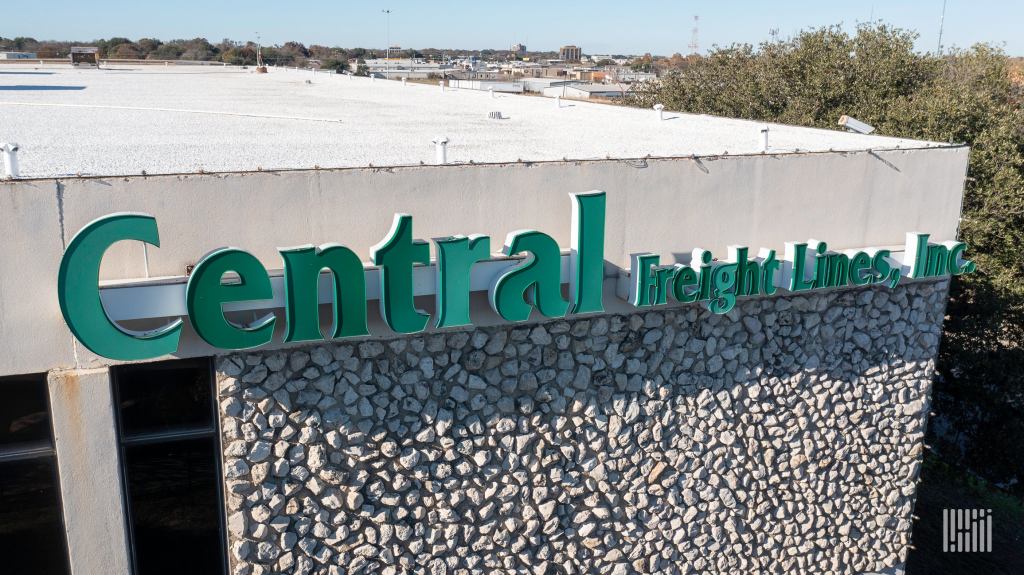
Exclusive: Central Freight Lines to shut down after 96 years

Nearly, 2,100 employees will be laid off right before Christmas. Central Freight Lines is the largest trucking company to close since Celadon ceased operations in 2019.


Waco, Texas-based Central Freight Lines has notified drivers, employees and customers that the less-than-truckload carrier plans to wind down operations on Monday after 96 years, the company’s president told FreightWaves on Saturday.

“It’s just horrible,” said CFL President Bruce Kalem.

A source close to CFL told FreightWaves that CFL had “too much debt and too many unpaid bills” to continue operating, despite exploring all available options to keep its doors open.

Kalem agreed.

“Years of operating losses and struggles for many years sapped our liquidity, and we had no other place to go at this point,” Kalem told FreightWaves. “Nobody is going to make money on this closing, nobody.” 

Central Freight will cease picking up new shipments effective Monday and expects to deliver substantially all freight in its system by Dec. 20, according to a company statement.

A source familiar with the company said he is unsure whether CFL will file Chapter 7 or “liquidate outside of bankruptcy,” but that the LTL carrier has no plans to reorganize.

The company reshuffled its executive team nearly a year ago in an effort to stay afloat, including adding the company’s owner, Jerry Moyes, as CFL’s interim president and chief executive officer. Moyes remained CEO after Kalem was elevated to president in July.

“I think it was surprising that there wasn’t a buyer for the entire company, but buyers were interested in certain pieces but not in the whole thing,” the source, who didn’t want to be identified, told FreightWaves. “Part of it could have been that just the network was so expansive that there was too much overlap with some of the buyers that they didn’t need locations or employees in the places where they already had strong operations.”

Third-party logistics provider GlobalTranz notified its customers that it had removed CFL as “a blanket and CSP carrier option immediately, to prevent any new bookings,” multiple sources told FreightWaves on Saturday.

CFL, which has over 2,100 employees, including 1,325 drivers, and 1,600 power units, is in discussions with “key customers and vendors and expects sufficient liquidity to complete deliveries over the next week in an orderly manner,” a CFL spokesperson said. Approximately 820 employees are based at the company headquarters in Waco.

Despite diligent efforts, CFL “was unable to gain commitments to fund ongoing operations, find a buyer of the entire business or fund a Chapter 11 reorganization,” another source familiar with the company told FreightWaves.

Kalem said the company had 65 terminals prior to its decision to shutter operations. 

FreightWaves received a tip from a source nearly two weeks ago that CFL wasn’t renewing its East Coast terminal leases but was unable to confirm the information with CFL executives. 

Another source told FreightWaves that some of the LTL carrier’s West Coast terminals had been sold recently, but that no reason was given for the transactions.

At that time, Kalem said the company was “working to find alternatives” and couldn’t speak because of nondisclosure agreements. He said executives at CFL, including Moyes, were trying to do everything to “save the company.”

“Jerry [Moyes] pumped a lot of money into the company, but it just wasn’t enough,” Kalem said.

Kalem said he’s aware that a large carrier is interested in hiring many of CFL’s drivers but isn’t able to name names at this point. 

“Central Freight is in negotiations to sell a substantial portion of its equipment,” the company said in a statement. “Additionally, Central Freight is coordinating with other regional LTL carriers to afford its employees opportunities to apply for other LTL jobs in their area.”

As of late Saturday night, Kalem said fuel cards are working and drivers will be paid for freight they’ve hauled for the LTL carrier until all freight is delivered by the Dec. 20 target date.

“I’m going to work feverishly with the time I have left to get these good people jobs — I owe it to them,” Kalem told FreightWaves. “We are going to pay our drivers — that’s why we had to close it like we’re doing now. We are going to deliver all of the freight that’s in our system by next week, and we believe we can do that.”

During the outset of the pandemic, Central Freight Lines was one of four trucking-related companies that received the maximum award of $10 million through the U.S. Small Business Administration’s Paycheck Protection Program (PPP). This occurred around the time that CFL drivers and employees were forced to take pay cuts, a move that didn’t go over well with drivers.

“It all went to payroll,” Kalem said about the PPP funds. “Yes, our employees and drivers did take a pay cut over the past few years, and we gave most of it back, even raised pay over the past several months, but it just wasn’t enough to attract drivers.”

FreightWaves staffers Todd Maiden, Timothy Dooner and JP Hampstead contributed to this report.


Watch: Central Freight Lines’ impact on the LTL market


FreightWaves CEO and founder Craig Fuller reacts to the Central Freight Lines news:

“With Central struggling for many years and unable to reach profitability, it makes sense that they would want to liquidate while equipment and real estate are fetching record prices.”


Central Freight Lines statement

Here is the statement given by Central Freight Lines to FreightWaves late Saturday after reports surfaced of its impending closure:

“We make this announcement with a heavy heart and extreme regret that the Company cannot continue after nearly 100 years in operation. We would like to thank our outstanding workforce for persevering and for professionally completing the wind-down while supporting each other. Additionally, we thank our customers, vendors, equipment providers, and other stakeholders for their loyalty and support.

“The Company explored all available options to keep operations going. However, operating losses sapped all remaining sources of liquidity, and the Company’s liabilities far exceed its assets, all of which are subject to liens in favor of multiple creditors. Despite diligent efforts, the Company was unable to gain commitments to fund ongoing operations, find a buyer of the entire business, or fund a Chapter 11 reorganization. Given its limited remaining resources, the Company concluded that the best alternative was a safe and orderly wind-down. As we complete the wind-down process, our primary goal will be to offer the smoothest possible transition for all stakeholders while maximizing the amount available to apply toward the Company’s obligations.

“Central Freight is in negotiations to sell a substantial portion of its equipment. Additionally, Central Freight is coordinating with other regional LTL carriers to afford its employees opportunities to apply for other LTL jobs in their area. Discussions are ongoing and no purchase of assets or offer of employment is guaranteed.”


Brief history of Central Freight Lines

1925Founded in Waco, Texas, by Woody Callan Sr.
1927Institutes regular routes in Texas between Dallas, Fort Worth and Austin.
1938Dallas facility opens as world’s largest freight facility.
1991Receives 48-state interstate operating authority, expands into Oklahoma.
1993Joins Roadway Regional Group and begins service in Louisiana.
1994Expands into Colorado, Kansas, Missouri, Illinois and Mississippi.
1995Consolidation of Central, Coles, Spartan and Viking Freight Systems into Viking Freight Inc. is announced. Central’s Waco corporate HQ starts closure.
1996Becomes the Southwestern Division of Viking Freight Inc.
1997Investment group led by senior Central management purchases assets of former CFL from Viking Freight and reopens as a new Central Freight Lines.
1999Expands into California and Nevada.
2009CFL Network provides service to Idaho, Utah, Minnesota and Wisconsin.
2013Acquires Circle Delivery of Tennessee.
2014Acquires DTI, a Georgia LTL carrier.
2017Acquires Wilson; new division created with an increase of 80 terminals.
2020Wins Carrier of the Year from GlobalTranz.
Acquires Volunteer Express Inc. of Dresden, Tennessee.
Source: Central Freight Lines

Warehouse cramming is about to begin — Freightonomics

nVision Global, is a leading Global Freight Audit, Supply Chain Management Services company offering enterprise-wide supply chain solutions. With over 4,000 global business “Partners”, nVision Global not only provides prompt, accurate Freight Audit Solutions, but also providing industry-leading Supply Chain Information Management solutions and services necessary to help its clients maximize efficiencies within their supply chain. To learn more, visit www.nvisionglobal.com

Warehouse space is at a premium right now and with peak season right around the corner, shippers are starting to scramble for space. 

Zach Strickland and Anthony Smith look into what shippers are doing to prepare for the end-of-year crunch. They welcome Zac Rogers from Colorado State University to the show to talk through the industry tightness. 

The three also talk about the latest Logistics Managers Index results and what they mean for the fourth quarter of 2021. 

You can find more Freightonomics episodes and recaps for all our live podcasts here.

Seasonality pushing rejections and rates higher ahead of the Fourth

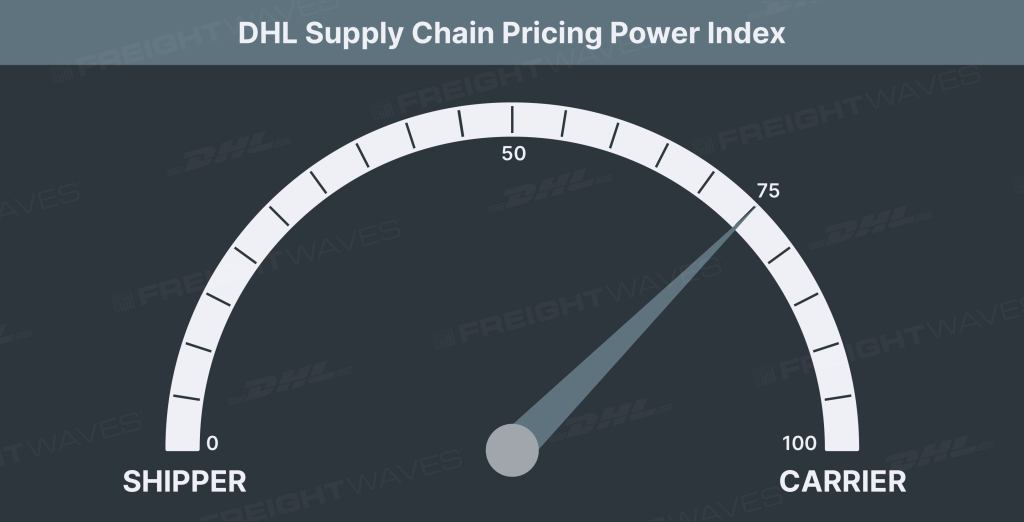
This week’s DHL Supply Chain Pricing Power Index: 75 (Carriers)

Last week’s DHL Supply Chain Pricing Power Index: 70 (Carriers) 

Three-month DHL Supply Chain Pricing Power Index Outlook: 70 (Carriers)

The DHL Supply Chain Pricing Power Index uses the analytics and data in FreightWaves SONAR to analyze the market and estimate the negotiating power for rates between shippers and carriers. 

The Pricing Power Index is based on the following indicators:

Load volumes: Absolute levels positive for carriers, momentum neutral

The Outbound Tender Volume Index at 15,980 is nominally higher now than basically at any point in the past 12 months with the exception of the week prior to Thanksgiving/Black Friday last year. OTVI captures all electronic tenders, including rejected ones, so when accounting for the rejection rate, we can get an even more accurate look at volumes. 

OTVI rose through the back half of May into the national holiday and has risen even further since. Throughout the back half of May and into the middle of June, tender rejections declined substantially. Meaning, current volume throughput is actually understated when comparing OTVI now to OTVI in November 2020. After adjusting for rejected tenders, the accepted outbound tender volume index is just 2.2% below the 2020 peak in November. At that time, OTVI surged towards 17,000, but the rejection rate moved in-kind towards its natural ceiling of 28%. So, the total accepted freight tenders in mid-June is comparable to the peakiest of peak seasons in 2020. Incredible. 

However, since the middle of June, tender rejections have begun increasing again heading into Independence Day, a time when many drivers spend time off the road with their families. The move higher in OTVI this week has been driven primarily by higher rejection rates, rather than higher freight demand. 

Over the past month, the drivers of freight volumes have continued to be imports and from just about every port. The west coast continues to provide seemingly non-stop container ships, while Houston, New Orleans, Miami and Savannah are seeing very strong throughput as well. 

It is van volumes that are driving freight markets higher right now. The Reefer Outbound Tender Volume index has tumbled 25% since its all-time high in the weeks after the polar vortex in February. Since Memorial Day, ROTVI has fallen another 10.5%. This is likely a factor of declining grocery demand, but I would expect the trend to reverse course in the near future as summer festivities accelerate. 

Dry van volumes pushed higher in the back half of May and into June while reefer volumes have declined significantly. 

SONAR: VOTVI.USA (Blue); ROTVI.USA (Green)

The congestion at our nation’s ports has spread from Los Angeles and Long Beach to Oakland, California. The California coastline is a parking lot of container ships, most of which are full to the brim with imports, awaiting berth. As detailed in the economic section, there are some signs that the reversion is underway with Americans paring back spending on pandemic superstar categories in favor of airlines, lodging and entertainment. But spending remains strong despite the moderation, and low inventory levels offset much of the decline that will occur from slowing demand. Real inventories are 3% higher now than pre-pandemic, but real sales growth is far outpacing inventory growth, leading to the lowest inventory-to-sales ratio in decades. 

On the manufacturing side, the ISM Manufacturing PMI expanded in May after declining in April. We’ve been in expansionary territory for 12 consecutive months. New orders, production, imports/exports and employment are all growing. The major issues should come as no surprise: Deliveries are slowing, backlogs are growing and inventories are too low. 

In all, there are many, many catalysts to keep freight demand strong for the foreseeable future. Americans are traveling and spending on services at a high clip, but the high savings rate is enabling it to occur without a massive detriment to goods spending. 

SONAR: OTVI.USA (2021 Blue; 2020 Green; 2019 Orange; 2018  Purple)

Tender rejections: Absolute level and momentum positive for carriers

After declining steadily from mid-March to mid-May, the Outbound Tender Reject Index has reversed course heading into Independence Day. This is typical for a national holiday as carriers selectively choose loads to bring drivers closer to home. OTRI now sits above 25% for the first time in June. 

One of our newest indices in SONAR gives us the ability to compare markets on as close to an apples-to-apples basis as possible. FreightWaves’ Carrier Trend Market Score indices are divided into two perspectives – shipper/broker and carrier. The scores are positioned on a scale from 1-100 and have values measuring van and refrigerated (reefer) capacity. The higher values represent more favorable trends for whichever perspective. For instance, a value near the high-end of the range would suggest very favorable conditions for carriers in our carrier capacity trend score index. 

For the past several weeks, capacity disparities have been driven by import volumes. The markets with the tightest carrier capacity coincide with the nation’s busiest ports. Ontario, California, Savannah, Georgia, and Atlanta all have carrier capacity trend market scores of 100. 

SONAR: Capacity Trend Market Score (Carriers – VAN)

By mode. Reefer rejection rates tumbled from it’s all-time high in March to under 35% in mid-June before popping higher over the past two weeks. Reefer rejections are still quite high from a historical standpoint at 38%, but are significantly lower than just three months ago when reefer carriers were rejecting half of all electronically tendered loads. 

SONAR: VOTRI.USA (Blue); ROTRI.USA (Orange)

Dry van tenders make up the majority of all tenders, so the van rejection rate mirrors the aggregate index closely. Van rejections have surged from ~23% to ~26% over the past two weeks. 

Yes, one-in-four loads being rejected is not ideal, but it’s better than 30%. I am unaware of any meaningful signals that capacity is being added at a rate that would change my outlook. With so many catalysts for demand, and many constraints on drivers including the Drug & Alcohol Clearinghouse, driver training school closures and continued government unemployment benefits, the outlook is tight throughout this year and into 2022. That’s not to say we won’t see improvement as consumers revert to pre-pandemic spending habits and drivers enter or reenter the market. But I’m not expecting any quick reversal of this environment; there are simply too many catalysts driving volume and suppressing capacity. 

SONAR: OTRI.USA (2020/21 Blue; 2020 Green; 2019 Orange)

Freight rates: Absolute level and momentum positive for carriers

Throughout June, spot rates have moderated while contract rates have pushed higher. The Truckstop.com dry van rate per mile (incl. fuel) has fallen from $3.21 to $3.11 since the beginning of June, while FreightWaves van contract rates have risen from $2.50 to $2.59/mile, exclusive of fuel. 

I still believe the Truckstop.com dry van national average will not retest the post-vortex surge pricing that brought spot rates up to an all-time high of $3.30. But, there aren’t many catalysts to bring spot rates down anytime soon either. Demand is unwavering with continued strong consumer goods demand, humming industrial recovery and a potentially cooling, yet still sizzling, hot housing market. And carriers can’t fill enough trucks to keep up with demand. 

Prior to the seasonal movements we’re seeing in tender rejections, routing guides generally had been improving through Q2. We should continue to see a convergence between spot and contract rates, but spot rates will remain historically very elevated throughout the summer as demand simply outstrips capacity. 

SONAR: TSTOPVRPM.USA (Blue); VCRPM1.USA (Green)  

Economic stats: Momentum and absolute level neutral

Several economic releases this week are worth noting.

Weekly jobless claims were released Thursday and give us one of the best close-to-real-time indicators of the overall economy.  This week, the data was again very promising as the labor market continues on a bumpy but trajectorially stable recovery path. 

First-time filings totaled 411,000 for the week ended June 19, a slight decrease from the previous total of 418,000 but worse than the 380,000 Dow Jones estimate, the Labor Department reported Thursday. Initial claims have held above 400,000 for consecutive weeks after falling to a pandemic low of 374,000 three weeks ago. As things stand, the current level of initial claims is about double where it was prior to the Covid-19 pandemic. 

The good news on the jobs front is that continuing claims are on the decline, falling to 3.39 million, a drop of 144,000. That number runs a week behind the headline claims total.

Initial jobless claims (weekly in May 2020-May 2021)

At the time of writing, the newest weekly data for the week ending May 29 had not been updated in SONAR. This week, claims fell from 405,000 to 385,000. 

SONAR: IJC.USA

Consumer. Turning to consumer spending, as measured by Bank of America weekly card (both debit and credit) spending data, total card spending (TCS) in the latest week accelerated to 22% over 2019. This is the first time in June that TCS has topped 20% over 2019, but spending has been running up 16-19% consistently on a two-year comp for months. For contect, the average pre-pandemic two-year growth rate was about 8% (from 2012 to 2019). 

The Bank of America team highlighted service spending in the nation’s two largest state economies, California and New York, which are now fully reopened. Spending at restaurants is now well above 2019 in both states, and the team believes there is more capacity for spending to accelerate in the states that were slower to reopen given pent-up demand. 

There was also a notable acceleration in spending on clothing this week, according to Bank of America. It could be a reversal from some softening in the early weeks of June, or an indication of people refreshing wardrobes ahead of a return to work, more travel and vacations. One tepid statement for freight markets from this week;s report: Leisure spending is on the rise and durable goods spending is flatlining.  

FreightWaves’ Flatbed Outbound Tender Reject Index, both a measure of relative demand and capacity, moves directionally with the ISM PMI. 

SONAR: ISM.PMI (Blue); FOTRI.USA (Green) 

Manufacturing. Over the past two weeks, regional manufacturing surveys have reported generally positive readings amid logistical challenges. The New York Fed’s Empire State business conditions index declined 6.9 points to 17.4 in June, retreating from strong readings the past two months. The Empire State Index is a diffusion index with a baseline of zero; any reading above zero indicates improving or expansionary conditions. 

Delivery times lengthened to a new record during the month, new orders and shipments fell, and inventories entered negative territory. The supply chain and transportation challenges are as visible upstream as downstream, but overall the manufacturing sector is handling. Growth continued throughout the second quarter in both the Empire State and Philly Fed indices. 

The Philadelphia Federal Reserve’s business activity index edged lower to a still robust 30.7 in June from 31.5 in the prior month. Unlike NY, the pace of shipments growth accelerated in the Philly region during June. The employment subcomponent rose to a very healthy 30.7 from 19.3 last month, the regional bank said. 

Record-long lead times, wide-scale shortages of critical basic materials, rising commodities prices and difficulties in transporting products are continuing to affect all segments of the manufacturing economy, but demand remains strong. 

For more information on the FreightWaves Freight Intel Group, please contact Kevin Hill at khill@www.freightwaves.com or Andrew Cox at acox@www.freightwaves.com.

Check out the newest episodes of our podcast, Great Quarter, Guys, here.

Project44 acquires ClearMetal to strengthen predictive tools

Project44, a leader in real-time visibility of the global supply chain, announced on Thursday it has acquired ClearMetal, a San Francisco-based supply chain planning software company that focuses on international freight visibility, predictive planning and overall customer experience. The terms of the acquisition were not disclosed.

ClearMetal, founded by top software engineers and data scientists from Stanford, Google and other Silicon Valley elites, has created a “continuous delivery experience” that leverages proprietary machine learning algorithms that can forecast supply chain disruptions. 

In an interview, Jason Duboe, chief growth officer at project44, explained that bringing in ClearMetal’s elite team is essential for the company’s future predictive solutions.

“Their team construct is fundamentally different. When you look at their data science, machine learning and computer science background, they are best in class,” he said. “Applying the team to solve really interesting challenges, starting with highly predictive ETA and deeper exception management to create more predictive analytics is really a key component here.”

Project44 recently acquired Ocean Insights to gain global supply chain vessel visibility and has announced it has expanded its truckload tracking services within Asia. Bringing on this new team of engineers will allow the company to capitalize on strong predictive tools, strengthening the supply chain of its customers.

“We’re going to be expanding deeper into Asia, and from a port perspective, getting data much earlier than competitors,” explained Duboe. “Our freight forwarder integrations will give us much deeper visibility from an end-to-end perspective in these regions.”

Along with the acquired skills the ClearMetal team will bring to project44, it brings a large book of customers, including large CPGs, retailers, manufacturers, distributors and chemical companies. These advanced use cases will strengthen the predictive planning tools, and project44 continues to expand into different customer markets.

“What we gain from ClearMetal is a holistic platform for anybody that joins the platform in the future,” said Duboe. “They have large customers with incredibly demanding and advanced use cases. So when it comes to order and inventory, functionality, supplier onboarding, and moving upstream into those processes, we can capture exceptions earlier on.”

Click here for more articles by Grace Sharkey.

Related Articles:

Project44 expands real-time visibility into China

Project44 reels in Ocean Insights in ‘largest acquisition in visibility space’

‘Project44’s vision has always been global’

Borderlands Mexico: USMCA gives Mexico an edge as global trade barriers rise

Borderlands Mexico is a weekly rundown of developments in the world of United States-Mexico cross-border trucking and trade. This week in Borderlands Mexico: USMCA gives Mexico an edge as global trade barriers rise; SpaceX plans $16.8B semiconductor factory in Texas; and Taiwan-based AI firm to invest $450M in Ciudad Juárez.

USMCA gives Mexico an edge as global trade barriers rise

Mexico is experiencing a new export boom that could strengthen its position at the center of North American supply chains — but whether that boom translates into a broader nearshoring investment wave and faster economic growth remains an open question.

The latest surge is being powered increasingly by technology rather than the automotive industry that has traditionally dominated Mexican manufacturing.

BBVA México economists said the country’s exports of machinery covered under Chapter 84 of the Harmonized System — a category increasingly driven by computers and data-processing equipment — have doubled in just a few years to roughly $200 billion on a trailing 12-month basis. 

Founded in 1932, BBVA México is the largest financial institution and bank in the country.

The bank tied much of the increase to massive spending by U.S. technology companies on artificial intelligence infrastructure and data centers.

Mexico’s real manufacturing exports, particularly higher-complexity products, are running above their long-term growth trend. Machinery, electrical equipment and vehicles — Chapters 84, 85 and 87 of the Harmonized System — now represent nearly three-quarters of the country’s manufacturing exports.

“Despite concerns over the recent shift in US trade policy away from free trade, Mexico is experiencing a new export boom,” BBVA economists said in a report released Tuesday.

The researchers said the expansion is being fueled by the AI capital expenditure cycle, escalating U.S.-China trade tensions and Mexico’s relatively favorable tariff position compared with other major U.S. trading partners.

The development could provide fresh evidence that nearshoring — the movement of manufacturing and supply chains closer to U.S. consumers — is evolving beyond the automotive, appliance and traditional maquiladora industries that have long defined cross-border trade.

Mexico gains ground as US supplier

Mexico’s biggest advantage remains geography combined with preferential access to the world’s largest consumer market.

Mexico and the U.S. have become each other’s largest trading partners, and roughly 16% of U.S. imports now come from Mexico, according to BBVA. Another analysis from the Economics Observatory puts Mexico’s share of U.S. imports at a record 17% in early 2026, more than double China’s 7.2%.

The Economics Observatory is a UK-based, ESRC-funded project that connects academic research and public policy to provide clear, reliable answers to major economic questions.

Mexico’s fastest-growing shipments to the U.S. include computers, phones and electronics, and the country overtook China in 2025 as the leading supplier of advanced technology products to the U.S., according to the Economics Observatory.

BBVA found that computer exports are highly correlated with U.S. private investment in information-processing equipment and spending by hyperscalers such as Microsoft, Alphabet, Meta and Amazon. 

BBVA said Mexico’s trade surplus in Chapter 84 is now entirely explained by computer exports, suggesting the country is developing a comparative advantage in the sector.

Electrical and electronics exports are growing as well. Chapter 85 includes televisions, phones, communications equipment, circuits and conductors — products that increasingly feed the AI and computer manufacturing supply chain.

The growth in electronics manufacturing in Mexico could have significant implications for cross-border trucking and logistics networks serving manufacturing centers such as Ciudad Juárez, Tijuana, Monterrey and Guadalajara as more high-value electronics and components move between Mexican factories and U.S. customers.

USMCA gives Mexico an increasingly valuable advantage

The export boom is unfolding as protectionism increases around the world, making Mexico’s access to the U.S. market potentially more valuable.

U.S. tariffs have risen to their highest levels since the 1960s, including higher duties on vehicles, steel, aluminum and other products. Mexico faces some of those measures, but USMCA keeps its overall effective tariff burden significantly below that of many competing manufacturing countries.

By the end of 2025, Mexico faced an effective U.S. tariff rate of less than 5%, compared with about 33% for China and an overall U.S. average of approximately 10%, according to the Economics Observatory. About 88% of Mexican goods already enter the U.S. duty-free under USMCA.

That differential could become one of Mexico’s most powerful nearshoring incentives.

For manufacturers deciding whether to supply U.S. customers from Asia, Europe or Mexico, proximity is no longer Mexico’s only advantage. Preferential tariff treatment can potentially alter the economics of where companies locate factories and suppliers.

However, USMCA itself has become a source of uncertainty.

The U.S. declined to extend the agreement through 2042 during this year’s joint review, beginning a process of annual reviews that could continue until the agreement’s scheduled expiration in 2036. The decision did not terminate USMCA or change its existing trade and investment rules.

That means the nearshoring equation increasingly depends on how companies assess the durability of North American trade rules.

SpaceX plans $16.8B semiconductor factory in Texas

SpaceX plans to invest more than $16.8 billion to build a massive semiconductor manufacturing facility in Grimes County, Texas, creating 3,000 jobs, according to a news release.

The first phase of the project, called Terafab, will be a vertically integrated semiconductor fabrication plant designed to consolidate SpaceX’s chip production under one roof. SpaceX received a $30 million Texas Enterprise Fund grant, and the project qualifies for incentives under the state’s Jobs, Energy, Technology and Innovation program.

The planned 100 million-square-foot facility will combine logic chip production, memory and advanced packaging, according to SpaceX. Jobs at the plant will include engineers, technicians and plant operators.

SpaceX (Nasdaq: SPCX) operates its Starbase headquarters and launch complex in South Texas and a Starlink manufacturing facility in Bastrop.

Taiwan-based AI firm to invest $450M in Ciudad Juárez

Taiwan-based Inventec, which manufactures servers, artificial intelligence products and electronics, recently announced a $450 million expansion in Ciudad Juárez that could create as many as 6,000 high-value jobs.

Chihuahua has become one of Mexico’s leading exporters of computer and AI equipment to the United States, according to the state government.

Founded in 1975, Inventec manufactures computers, telephones, notebooks, and servers and has developed a strong foundation for global success. The company has more than 30,000 employees operating in 9 countries worldwide.

Why it matters: Mexico’s technology-led export boom is strengthening its position as a preferred U.S. manufacturing platform, but the next phase of nearshoring will depend on whether record trade flows can trigger substantially more investment and North American supply-chain development.

Modal shift dampens trucking market

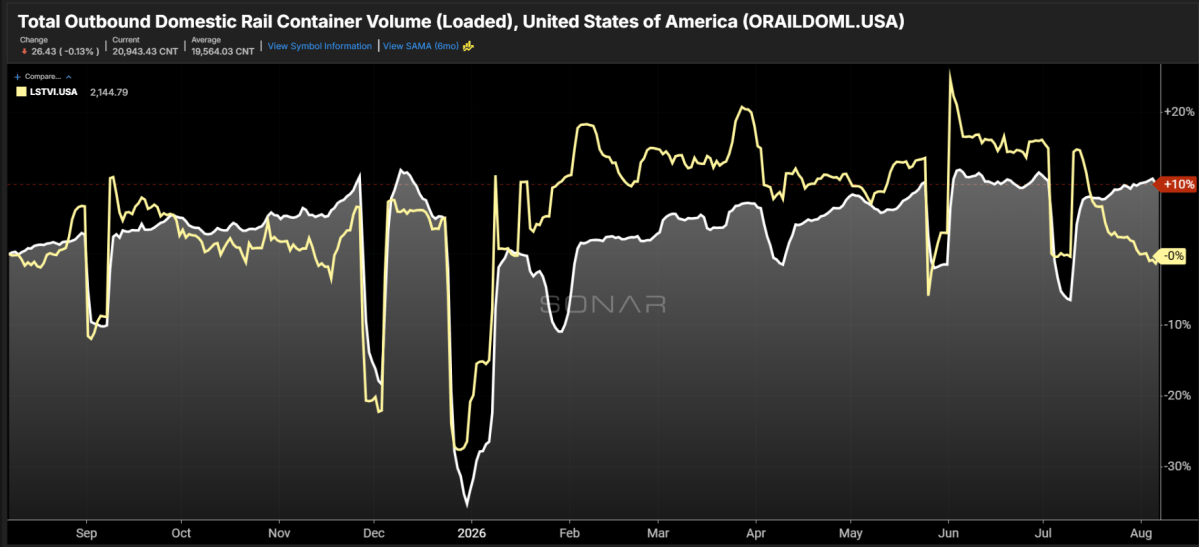
Chart of the Week: Loaded Domestic Rail Containers, SONAR long haul tender volume index – USA SONAR: ORAILDOML.USA, LSTVI.USA

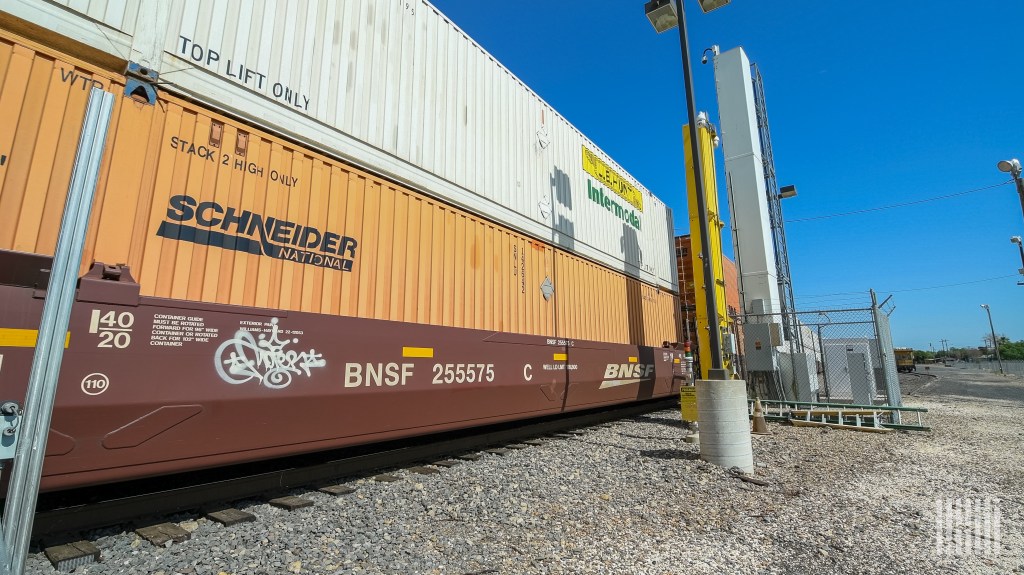
Intermodal use has grown 10% compared to 2025 for domestic-sized containers (ORAILDOML), while long-haul tender volumes (LSTVI) are flat. The two modes have been moving in opposite directions since the middle of July, with truckload demand falling faster than seasonally expected. This suggests shippers are once again looking to escape the elevated costs and challenges of the trucking space by utilizing the rails. Will this accelerate the end of this truckload upcycle?

Long-haul tender volumes are defined as tenders for loads moving more than 800 miles. This segment is the most fungible with intermodal, and it is also where intermodal has the most significant cost advantages for shippers.

Total tender volumes are up 6% y/y over the past week, with long-haul tenders being the only segment that does not show annual growth. On top of that, the LSTVI has also fallen to its lowest point of the year, which is unusual to see in August, especially as imports have been strong into the California ports.

Long-haul trucking demand is heavily tied to imports, as around 30-40% of container imports arriving from overseas clear through the port complexes of Los Angeles and Long Beach. Much of that freight moves across the country to the major cities on the East Coast, where most of the population lives.

While Los Angeles is the main gateway, much of the freight stays in an international container and moves across the country before getting transloaded into a truck or domestic container. Chicago is the largest market for domestic container shipping in the U.S. and has had a 9% growth rate compared to last year, versus Los Angeles’s increase of only 3%. Atlanta, which gets fed by Savannah and Los Angeles containers, has seen over 20% growth in domestic container volumes. 

The primary driver appears to be a rapid increase in truckload costs. Truckload contract rates from Chicago to Elizabeth, NJ are up 31% (including fuel), compared to intermodal’s 5%. Trucking rates from Atlanta to Elizabeth are up nearly 60%, compared to just 6% for intermodal. These differentials are too great for many shippers to overlook. 

Growing risks 

While the cost savings are undeniable, and any shipper with the ability to leverage intermodal has to consider it, these spreads are unsustainable, and rail infrastructure has its limitations.

Rate increases are a certainty for intermodal carriers. They could raise rates into the double digits and still not risk losing business based on cost. There is simply too much money on the table — though the looming transcontinental merger may help hold rates down on some level until a ruling is made.

We are also not quite at intermodal’s peak season, which traditionally occurs in September and October. The rails have been able to manage the additional demand stress thus far, but drayage is a going concern with severe limitations tied to the same issues constraining longer-haul trucking.

The third potential factor that could change the market dynamic is a returning sense of urgency. There is little seasonal pressure on shipping in August compared to the holiday periods, and back-to-school demand has largely already arrived. Inventory levels, especially on the downstream end, are tighter than they have been in recent years, as Dr. Zac Rogers — co-author of the LMI — discussed on this past week’s Freightonomics podcast. This could mean that shippers are more exposed to unexpected demand shocks, which favors trucking over intermodal shipping.

So while there is no doubt that the shipping community is doing the right thing in the moment, there are reasons to make sure they are prepared for the risks of relying too heavily on a single mode of transportation, as the freight market and supply chain management remain a dynamic space with no clear path forward.

About the Chart of the Week

The FreightWaves Chart of the Week is a chart selection from SONAR that provides an interesting data point to describe the state of the freight markets. A chart is chosen from thousands of potential charts on SONAR to help participants visualize the freight market in real time. Each week a Market Expert will post a chart, along with commentary, live on the front page. After that, the Chart of the Week will be archived on FreightWaves.com for future reference.

SONAR aggregates data from hundreds of sources, presenting the data in charts and maps and providing commentary on what freight market experts want to know about the industry in real time.

The FreightWaves data science and product teams are releasing new datasets each week and enhancing the client experience.

To request a SONAR demo, click here.

Police: Little Debbie snack fraud scheme involved deliveries that never happened

A West Virginia distributor faces 15 criminal charges in Pennsylvania involving an alleged Little Debbie snack delivery fraud scheme. The City of Washington Police Department in Pennsylvania filed charges against James Powell of Valley Grove, West Virginia. Authorities are seeking $17,167.97 in restitution, according to a department release provided directly to FreightWaves. Powell remains in custody while undergoing extradition from West Virginia to Washington County, Pennsylvania.

Police allege Powell created fraudulent delivery invoices while working as a distributor. Those records showed Little Debbie products reaching Pennsylvania retail stores when the deliveries never occurred. Investigators also accuse him of using forged employee signatures to falsely verify receipt of merchandise. The invoices then entered the manufacturer’s central billing system.

The investigation identified Shop N’ Save, Giant Eagle and Walmart locations within Washington County, Pennsylvania. Stewart Snacks LLC operates as an independent distributor of Little Debbie snack products. Authorities allege the company reimbursed affected retailers and the manufacturer for resulting losses. Powell received commission payments for deliveries that never occurred, according to the release.

Investigation started in Ohio

The case began after Stewart Snacks reported suspected fraudulent business records and missing products. The company initially contacted the Jefferson County Sheriff’s Office in Ohio. Investigators later determined that offenses occurred within Washington, Pennsylvania, and South Strabane Township, Pennsylvania. Authorities then referred the matter to the City of Washington Police Department.

Washington police conducted an extensive investigation after receiving the case. Detectives examined delivery invoices connected with several retail locations in Pennsylvania. Their findings included records that allegedly documented merchandise customers never received. Investigators also identified signatures they contend falsely confirmed those transactions.

The department consulted with the Washington County District Attorney’s Office in Pennsylvania before filing criminal charges. Powell now faces three second-degree felony counts of forgery. Prosecutors also brought two third-degree felony counts each for theft by deception and unlawful taking. Another third-degree felony accuses him of deceptive or fraudulent business practices.

Charges include forgery and theft

Seven first-degree misdemeanor counts complete the 15 charges filed against Powell in Pennsylvania. Three involve tampering with records or identification. Separate counts accuse him of theft by deception and unlawful taking. Two additional charges involve deceptive or fraudulent business practices.

Authorities later took Powell into custody in West Virginia under an arrest warrant connected with the Pennsylvania investigation. He is undergoing extradition proceedings, according to Washington police. That process would return him from West Virginia to Washington County, Pennsylvania. Powell will answer to the filed criminal charges there.

All charges remain allegations. Powell is presumed innocent unless and until proven guilty in court.

Why it matters

Fraudulent paperwork can make a nonexistent delivery appear legitimate inside normal business systems. Verification controls can help companies identify inconsistencies before invoices, payments or commissions move through that process.

Click here for more articles on cargo theft and freight fraud by Phil Brink.

CargoNet reports $304.6M in losses, Scott Cornell says Q2 theft drop is no trend yet – FreightWaves

$20M in cocaine found beneath floorboards of commercial truck trailer at California border – FreightWaves

392 stolen vehicles worth $28M stopped before overseas export, RCMP says – FreightWaves

New parcel surcharge helps Postal Service reach $20B in revenue

Side view of a modern U.S. Postal Service delivery van parked on a city street.

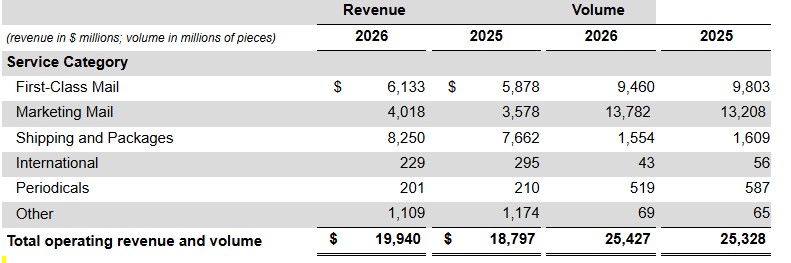
The U.S. Postal Service on Friday said a parcel surcharge implemented in April to cover rising fuel and transportation costs and higher stamp prices helped boost overall revenue to nearly $20 billion for the fiscal third quarter, with Postmaster General David Steiner criticizing regulators for recently limiting more frequent price hikes aimed at restoring the organization’s financial viability.

The national postal operator reduced its net loss year over year by 18.2%, or $584 million, to $2.5 billion. The controllable loss, which excludes mandated obligations outside management’s control, was $1.04 billion. 

Operating revenue for the three months ended June 30 was $19.9 billion, up 6.1%, compared to the same period last year. The Postal Service attributed the gains to increases in stamp prices for First-Class and marketing mail and the new parcel fees, which are set to expire on Jan. 17. The increases were partially offset by declining mail and package volumes.

Postmaster General David Steiner also credited the better result to higher operating revenues, network optimization that has improved service while reducing work hours, and a decrease in workers’ compensation, even as overall costs increased. But postal officials acknowledge that Delivering for America, the 10-year strategic plan for modernizing and revitalizing the Postal Service, has not met service or financial targets at the midway point, while noting that service quality has picked up since Steiner took the helm last summer. The integration of distribution centers, technology and equipment, for example, is occurring without glitches that occurred in the past, he added. 

(Why It Matters: If the national mail carrier can’t repair its finances taxpayers might be asked to subsidize operations or face reduced service levels, and since the agency competes against private parcel carriers its business plan is important to follow.)

Cash-conservation measures, such as deferring payments to employee pension and retirement funds, have given the Postal Service sufficient liquidity to continue operating normally through at least August 2027. After that, the Postal Service will have to start making hard decisions about what activities to prioritize unless Congress provides some relief, Steiner said. And the agency could hit a full liquidity cliff in 2031 he told Congress in June.

Steiner reiterated Friday that the quasi-public agency needs legislative and regulatory reforms that give the agency freedom to operate like a private enterprise and shed onerous statutory obligations for managing pension and retirement funds.

The mandate for universal mail coverage is a major structural impediment. Mail volumes have declined more than 50% since 2007 as the number of delivery points continues to grow. Last year, the USPS added 1.8 million new stops to its route network — adding to delivery costs. The extra workload, combined with lower mail volume, has resulted in a drop in the average number of pieces delivered per stop from 5.5 in 2007 to 2.4 pieces in 2025. 

Steiner called on Congress to provide temporary investments and eliminate unfunded mandates so it can maintain current service levels. If Congress doesn’t want to help the Postal Service grow then it will have to consider reducing service levels and closing thousands of post offices, as well as raising prices, to break even, the postal chief said. 

“The bottom line is that we need to fix the business model that has produced the 17-year-long imbalance in costs and revenue,” Steiner said, later adding, “As  we reduce costs and improve revenue, we believe we will become more profitable, and the appropriation could be reduced.”

Steiner said the Postal Regulatory Commission’s decision to limit price increases to once a year cost the Postal Service $700 million in lost revenue. The organization recently filed a request to raise stamp rates in January using a different methodology it says will raise more money.

Steiner has made it a priority to improve revenues, including through more aggressive pricing on letters and bulk mail. 

“Use of our pricing authority is absolutely necessary to improve our financial sustainability and we need to be given more flexibility if we are expected to cover our costs,” he said. “Obviously, we would like to both grow volumes and grow revenue, but if we can only do one, we want to do it in a way that maximizes total revenue. That is what all companies do — from airlines to grocery stores, they apply revenue management principles to maximize profitability. Thus far, applying those basic principles has favored raising prices even though there has been a modest decrease in volumes.

“All of the statistics and results show that we have yet to cross the point that we should be changing our pricing strategy, and that we have more price to take in the marketplace. It would be financially irresponsible of us not to do so,” Steiner said in remarks to the board of governors. 

The 8% parcel surcharge drove up parcel shipping revenue by 7.7% despite a 3.4% decline in volume. Parcel volume for the first nine months of the fiscal year were down 6.2% to 4.9 billion pieces.

Operating expenses increased 2% due to a rise in payment levels for retiree health benefits, wages and fuel costs since the start of the Iran war. 

Click here for more FreightWaves/American Shipper stories by Eric Kulisch.

Write to Eric Kulisch at ekulisch@freightwaves.com.

Postal Service moves half of long-distance mail by air just to satisfy UPS contract

DHL outsources last-mile parcel delivery to US Postal Service for $10B

USPS quarterly parcel volumes fall 12% as e-commerce plan implemented

Transition Trucking Award names 2026 Elite 11 semifinalists

Kenworth T680 with 76-inch sleeper, the Transition Trucking award grand prize

Veteran hiring has become one of trucking’s steadiest talent pipelines. Once a year, the industry puts 11 names and a new truck behind that idea.

Kenworth, Fastport and the U.S. Chamber of Commerce Foundation’s Hiring Our Heroes initiative on Wednesday named the semifinalists, the “Elite 11,” for the 2026 Transition Trucking: Driving for Excellence award. The Transition Trucking award enters its 11th year, and the grand prize has not changed: a new Kenworth T680.

For fleets, the program doubles as a recruiting showcase. Nominations arrived from carriers, driver training schools, a private fleet and individuals across the country, and the resulting class spans four branches of the U.S. Armed Forces.

“This year’s ‘Transition Trucking: Driving for Excellence’ Elite 11 semifinalists exemplify the dedication, leadership, and commitment to service that military veterans bring to the trucking industry,” said Kyle Kimball, Kenworth director of marketing. “Kenworth is honored to celebrate 11 years of partnership with Fastport and the U.S. Chamber of Commerce Foundation’s Hiring Our Heroes initiative, and we look forward to recognizing this exceptional class of semifinalists.”

Apprenticeship Is Now the On-Ramp

Registered apprenticeship supplied most of this year’s field. Six in 10 nominations came from drivers completing or already finished with a U.S. Department of Labor Registered Apprenticeship program. Five of the Elite 11 are apprentices today.

That matters for carriers still building driver-development programs from scratch. The apprenticeship route is no longer experimental.  It has become the dominant path into the cab for this cohort of veterans.

Who Made the Transition Trucking Award Roster

The 2026 Elite 11, with employer and training provider:

  • Jeffrey Barber, U.S. Army Sergeant First Class (E-7), Prime Inc., trained by Prime Inc.
  • Brandon Ward, U.S. Navy Senior Chief Petty Officer (E-8), Werner Enterprises, trained by Roadmaster Drivers School, Orlando, Fla. (Registered Apprenticeship)
  • Mohammad Arzola, U.S. Marine Corps Sergeant Major (E-9), HEB, trained by California Career Schools
  • Juan Rosado Lozada, U.S. Marine Corps Lance Corporal (E-3), Roehl Transport, trained by Troops Into Transportation, Fort Benning
  • Kishawn Forbes, U.S. Navy Senior Chief Petty Officer (E-8), Melton Truck Lines, trained by Florida State College at Jacksonville
  • Gary W. Williams, U.S. Army Command Sergeant Major (E-9), Stevens Transport, trained by Southern Careers Institute
  • Monica Brooks-Buck, U.S. Army Sergeant First Class (E-7), Werner Enterprises, trained by Truck Driver Institute, Saucier, Miss. (Registered Apprenticeship)
  • Jenn Wilken, U.S. Army Staff Sergeant (E-6), Prime Inc., trained by Prime Inc.
  • Daryus Jones, U.S. Army Private First Class (E-3), Anheuser-Busch, trained by Tulsa Technology (Registered Apprenticeship)
  • Daniel Doss, U.S. Air Force Staff Sergeant (E-5), Melton Truck Lines, trained by Troops Into Transportation, Fort Benning (Registered Apprenticeship)
  • Michael R. Bivens, U.S. Marine Corps Staff Sergeant (E-6), Stevens Transport, trained by Tennessee Truck Driving School (Registered Apprenticeship)

What the Winner Drives Home

For the 11th consecutive year, Kenworth is supplying the grand prize. The T680 comes with a 76-inch sleeper and the full PACCAR Powertrain: the MX-13 engine, TX-12 automated transmission and DX-40 tandem rear axles.

The spec sheet leans on safety and driver retention features rather than raw hardware. It includes Kenworth’s DigitalVision Mirrors, Bendix Fusion Adaptive Cruise Control with Stop and Auto Go, and Lane Keeping Assist with Torque Assisted Steering.

Inside, the sleeper carries a Diamond VIT interior in charcoal, heated and cooled leather seats with titanium accents, a factory-installed refrigerator and a rotating work table.

The Road to West Point

Semifinalists will be honored Sept. 22 and 23 with a recognition dinner at the National Veterans Memorial and Museum in Columbus, Ohio, followed by a tour of Kenworth’s Chillicothe plant, where the finalists will be announced.

Public voting opens Nov. 1 and runs through Veterans Day on Nov. 11. Voting feeds directly into the selection committee’s final deliberations, which determine both the finalists and the winner.

The 2026 winner will be named Dec. 14 at the Veteran Ready Summit at the United States Military Academy at West Point.

“The Transition Trucking award campaign continues to spotlight the extraordinary contributions veterans are making in the transportation industry while introducing a new generation of service members to the real economic opportunities a trucking career can offer,” said Eric Eversole, president of Hiring Our Heroes and a vice president of the U.S. Chamber of Commerce. “As we celebrate the program’s 11th year, we’re proud to honor this remarkable Elite 11 and the decade of veteran success they represent.”

CargoNet reports $304.6M in losses, Scott Cornell says Q2 theft drop is no trend yet

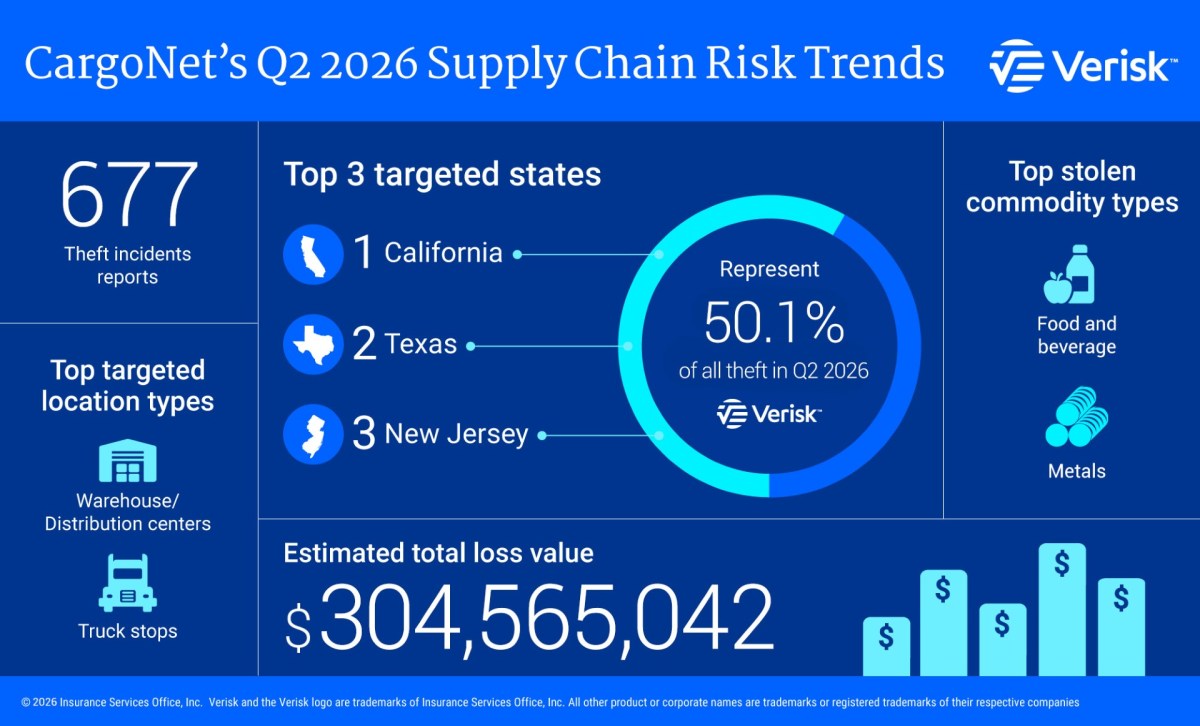
Fewer cargo theft reports did not mean smaller losses during the second quarter, according to Verisk CargoNet’s analysis. The intelligence network documented 677 incidents across the United States and Canada. That total fell 26% from Q2 2025. It also dropped 14% from the previous quarter.

Estimated cargo losses nevertheless climbed to $304.6 million during the three-month period. That figure more than doubled the $135.7 million reported during Q2 2025. The average reported commodity value reached $564,009. Several multimillion-dollar thefts involving metals and enterprise technology heavily influenced that average.

“Lower incident volume should not be mistaken for lower risk,” Keith Lewis, Verisk CargoNet’s vice president of operations, said. “The groups driving the largest losses are not necessarily trying to steal more freight; they are trying to identify the right shipment.” Lewis pointed to metals and enterprise technology as areas attracting organized theft groups. Those shipments can offer major value and established resale opportunities.

One quarter does not establish a trend

Scott Cornell, EVP, Crime and Theft Specialist at SPG Cargo & Logistics and chair of TAPA Americas, discussed the results during a recent FreightWaves interview. He described the decrease as welcome news after years when theft activity stayed elevated. Cornell also urged the industry to avoid treating one quarter as proof of a broader shift. “It’s not going to be a trend until we see it for maybe two or three quarters consecutively,” Cornell said.

Cornell noted that cargo theft numbers have historically moved up and down. He said recent law-enforcement arrests could be contributing to the quarterly decrease. Those efforts included operations in New York, New Jersey, California and Canada, along with FBI and Homeland Security cases. Cornell called the results from law enforcement and private-sector cooperation encouraging.

CargoNet’s data showed declines in physical thefts involving loaded equipment and non-delivery schemes. Those schemes involved bad actors acquiring established motor carriers, booking freight under their operating authority, then failing to deliver it. California and Texas recorded notable reductions in that activity. Theft classifications dropped from 488 events during Q2 2025 to 378 this year.

Fictitious pickup incidents moved far less, falling from 165 reports to 158. CargoNet also found steady activity involving business email compromise and shipment misdirection. Compromised accounts can expose shipment details, contact directories and transportation-management tools. Criminals can then impersonate trusted parties or alter load information.

Metals and technology drove severity

Metal theft increased from 54 incidents during Q2 2025 to 80 this year. Copper remained the most frequently targeted metal. Aluminum, nickel, tungsten and other specialized materials also drew increased attention. Cornell noted that CargoNet’s numbers placed metals second among commodity categories, behind food and beverage.

“Copper has been number one for two years now,” Cornell said. “That’s the longest stretch I’ve ever seen on copper.” He added that companies moving metals need to slow down and place stronger controls around those shipments. He described targeting as a question of when, not whether, for many metal loads.

CargoNet also identified continued targeting of enterprise computer equipment, networking components and cryptocurrency mining hardware. Those loads can carry multimillion-dollar values while moving as conventional dry freight. Food and beverage thefts declined overall, including mixed grocery products and alcoholic beverages. Seafood thefts moved the other direction, increasing by 11 events.

Why It Matters: Lower incident counts offer some positive news, but $304.6 million in reported losses shows the financial exposure remains serious. CargoNet’s findings give brokers, carriers and shippers specific commodities and tactics to watch more closely.

In my opinion, the report shows why fraud prevention cannot sit with one person or department. CFCO training helps teams build consistent verification around carrier identity, email changes and shipment instructions before freight moves. Fraud does not beat smart people. It beats inconsistent processes.

Click here for more articles on cargo theft and freight fraud by Phil Brink.

Truck driver admits $510K fuel card fraud without buying fuel – FreightWaves

$20M in cocaine found beneath floorboards of commercial truck trailer at California border – FreightWaves

392 stolen vehicles worth $28M stopped before overseas export, RCMP says – FreightWaves

Mexico plans major expansion of busiest cross-border truck crossing 

The Mexican state of Tamaulipas plans to begin work by the end of the year on a major expansion of the World Trade Bridge in Nuevo Laredo, a project aimed at increasing truck capacity and speeding freight flows through one of North America’s busiest freight corridors.

Tamaulipas Secretary of Public Works Pedro Cepeda Anaya said construction on the Puente Internacional Nuevo Laredo III, commonly known as the World Trade Bridge, is scheduled to begin during the second half of 2026, according to a news release.

The project calls for widening the bridge’s existing structure from eight to 10 lanes and constructing a parallel eight-lane span. Once completed, the crossing will have 18 lanes dedicated to commercial cargo traffic.

The expansion would more than double the bridge’s current lane capacity as freight volumes continue to grow between the United States and Mexico.

“This will substantially increase the operational capacity of Mexico’s principal commercial crossing,” the Tamaulipas government said in announcing the project.

Officials did not disclose the project’s estimated cost or a completion date.

The World Trade Bridge connects Nuevo Laredo, Tamaulipas, with Laredo, Texas, and is one of the primary arteries for trucks moving manufactured goods, automotive products, electronics, machinery and other freight between Mexico and the United States.

Tamaulipas officials said approximately 50% of Mexico’s cargo transportation passes through the crossing. Cepeda said increasing capacity is expected to shorten crossing times, lower logistics costs and improve the competitiveness of companies using the corridor.

The project comes as cross-border commerce through Laredo continues to surge.

The Laredo port of entry remained the busiest international trade gateway in the United States in May, handling $36.33 billion in imports and exports, up 19.36% year over year, according to an analysis of U.S. Census Bureau data by WorldCity.

Mexico accounted for about 97% of Laredo’s international trade during the month. The gateway handled $12.09 billion in exports and $24.24 billion in imports.

The bridge expansion also comes as overall U.S.-Mexico commerce continues to set a strong pace in 2026.

Mexico was the United States’ largest trading partner in May, with $87.23 billion in two-way trade, a 17.06% increase from a year earlier. U.S. exports to Mexico totaled $33.05 billion, while imports reached $54.18 billion. Through the first five months of the year, bilateral trade totaled $404.57 billion.

Tamaulipas officials said additional capacity at the World Trade Bridge could support manufacturers and other industries that depend on time-sensitive cross-border supply chains. A report on the project identified automotive, electronics, manufacturing and agribusiness among sectors that could benefit from shorter border waits and increased capacity, according to Pro Mexico Industry.

Why it matters: More than doubling cargo-lane capacity at the World Trade Bridge could remove a critical bottleneck along the busiest U.S.-Mexico freight corridor as cross-border trade volumes continue to climb.

Indiana truck inspections sideline more than 1,100 drivers and vehicles

During July, Indiana State Police inspectors uncovered more than 8,600 commercial trucking violations and placed nearly 1,200 drivers and vehicles out of service during an enforcement push that included several multistate safety operations.

The Indiana State Police Commercial Vehicle Enforcement Division conducted 4,703 commercial motor vehicle inspections from June 15 through July 15, according to statistics released by the agency.

Those inspections resulted in 8,650 violations, along with 575 drivers and 597 vehicles being placed out of service. Inspectors also recorded 256 overweight violations and 46 oversize violations.

Combined, 1,172 drivers and commercial vehicles were placed out of service during the period.

Indiana joined multiple July enforcement blitzes

The inspection numbers came as Indiana State Police participated in a series of coordinated commercial vehicle enforcement campaigns throughout July.

From July 6-10, Indiana worked with enforcement agencies in Michigan, Illinois and Ohio on an initiative targeting violations of state laws requiring motorists to move over or slow down for stationary vehicles.

Indiana inspectors also participated in the Commercial Vehicle Safety Alliance’s annual Operation Safe Driver program from July 12-18. The North American enforcement campaign targets unsafe driving behaviors involving commercial motor vehicles.

From July 19-25, Indiana State Police participated in the Six State Trooper Project, another initiative focused on move-over and slow-down violations.

The month’s enforcement efforts culminated with Operation Highway Shield from July 28-30, a coordinated operation involving Indiana, Iowa, Illinois and Ohio along with the Federal Motor Carrier Safety Administration and several Department of Homeland Security agencies.

Federal officials said Highway Shield targeted unqualified commercial drivers, unsafe vehicles and fraudulent commercial driver licensing practices during roadside inspections along major freight corridors in the four states.

The three-day operation resulted in 86 arrests and 766 drivers and vehicles being placed out of service across the four states. Authorities also reported 36 English-language proficiency violations, 51 immigrants detained, 21 non-domiciled CDL holders detained and nearly $1 million in stolen cargo recovered.

The federal statistics did not provide a state-by-state breakdown showing how many of those arrests or out-of-service orders occurred in Indiana.

Indiana commercial vehicle enforcement results

Enforcement measureResults
Commercial vehicle inspections4,703
Total violations8,650
Drivers placed out of service575
Vehicles placed out of service597
Combined driver/vehicle OOS1,172
Overweight violations256
Oversize violations46
Source: Indiana State Police; statistics cover June 15-July 15.

Why it matters: Indiana sits at the crossroads of major Midwest freight corridors, and the state’s July enforcement numbers show trucking regulators are expanding scrutiny beyond federal crackdowns to sustained inspections targeting driver qualifications, vehicle safety, weight compliance and unsafe driving.

Miinor change in truck job numbers, bigger shift in warehouses

There were 100 more workers in truck transportation in July than in June, according to the Bureau of Labor Statistics. But there were a lot fewer warehouse workers than a month earlier.

The monthly jobs report showed truck transportation employment dropping by those 100 positions in July relative to June. It also reflected a downward revision of 1,500 jobs from the initial report of truck transportation jobs in June. May was revised downward by 200 jobs.

The end result is that the BLS reported 1,465,100 jobs in February. In July, the number of truck transportation jobs reported by the BLS was exactly the same.

That isn’t the case for warehouse workers. That number declined by 9,500 jobs to 1,834,600 jobs. 

While the one-month decline was large, it wasn’t even the biggest in the last year. Declines of 16,000 jobs and 13,500 jobs were reported for September and October 2025, respectively. The end result is that warehouse jobs are down 34,700 jobs since July 2025, a drop of 1.8%.

To grow or not to grow

Mazan Danaf, the principal economist at Uber Freight, said carriers are “actively seeking to expand fleets to capitalize on rising spot rates and strengthening demand,” though he added in an email to FreightWaves that it was a challenge to do so “despite a restrictive regulatory environment.”

Danaf also added that some of the subsector data in the jobs report was positive, “with long-distance truckload employment growing for four consecutive months through June.”

But a different view came from David Spencer, vice president of market intelligence at Arrive Logistics. In an email to FreightWaves, he said the fact that employment is holding relatively steady even as rates are rising “highlights carrier priorities for replacing aging equipment and focusing on necessary driver wage increases, instead of additional growth at this point in the cycle.”

Danaf also took a long-term view:  truck transportation employment reported by the BLS is 3.2% below its 10-year average, “suggesting that a full capacity recovery remains a long-term prospect.”

Up and down couriers

One sector that did add a significant number of jobs was couriers. They were up to 1,098,00 jobs from 1,083,100 jobs. 

But as independent economist Aaron Terrazas pointed out, that looked good mostly because the BLS sharply revised downward its June figure, with the 1.083 million jobs now reported well under the original report of 1,097,200 jobs.

Terrazas also noted that not only were the July numbers for warehouse workers down, but they were revised downward for May and June as well. The end result is that while the July number of 1.834 million jobs is more than it was in the first three months of the year, “revisions have erased any sense of a summer rebound in warehousing employment,” Terrazas said.

Spencer didn’t see much of a landscape for big truck transportation gains going forward. “Capacity remains constrained as carriers struggle with high fuel prices and a shifting regulatory landscape,” he said. “Continued regulatory enforcement and the recent SCOTUS ruling on broker liability are the most recent examples of how the challenges continue to develop for carriers and drivers. Insurance costs and access, and safety ratings are two big issues that could further restrict capacity in the coming months.”

In other highlights from the report:

  • Rail jobs were revised down from both May and June, and the July figure of 149,300 jobs was 400 jobs less than June. Although movement in number is generally small, the cumulative declines  have added up and rail jobs are now 5,100 jobs less than they were a year ago, a decline of 3.2%.
  • Average hourly earnings for production and nonsupervisory truck transportation employees edged up to $32.35 for June, which operates on a one-month lag. But it is still less than the April figure of $32.38.

More articles by John Kingston

C.H. Robinson earnings call shifts to nuclear verdict as key topic

Shipper liability takes another Texas setback; CHRW plays offense

RXO, post-Montgomery, sees benefit in its insurance, vetting

Truck enforcement sweeps sideline 30 drivers, 49 vehicles across US, Canada

Commercial vehicle enforcement agencies across the U.S. and Canada are stepping up roadside inspections and targeted operations, placing dozens of truck drivers and vehicles out of service for violations.

Recent enforcement actions in Arizona, Nebraska, New York, British Columbia and Saskatchewan resulted in hundreds of violations, along with citations and out-of-service orders. The violations ranged from equipment defects and licensing problems to illegally transporting hazardous materials

The operations come amid heightened scrutiny of commercial vehicle safety and driver qualifications across North America.

Arizona operation finds 280 violations in 67 inspections

Arizona authorities placed 20 commercial drivers and 15 vehicles out of service during a two-day enforcement detail along Interstate 10 between Tucson and Benson.

Law enforcement agencies conducted 67 commercial vehicle inspections July 29-30 in an I-10 construction zone, uncovering 280 driver/vehicle examination report violations.

Authorities also issued 19 seat belt citations, 16 hazardous moving citations and nine citations for cellphone use. Three wide loads were found operating without permits.

Nebraska inspections sideline drivers and trucks

Nebraska authorities conducted two recent commercial vehicle enforcement operations that collectively placed 10 drivers and 19 vehicles out of service.

The Nebraska State Patrol’s Carrier Enforcement Division inspected 35 commercial vehicles July 23 in Platte County, discovering 151 violations of federal motor carrier safety regulations and state law.

Troopers placed 14 vehicles and three drivers out of service and issued 16 citations. Inspectors also awarded 19 Commercial Vehicle Safety Alliance decals to trucks that had no immediate safety issues.

The Metropolitan Aggressive and Prevention Selective, or MAPS, Team focuses partly on commercial vehicles that may not regularly pass through weigh stations. The federally funded program checks compliance with regulations covering weight, size, registration, dyed fuel and permits.

A separate Nebraska operation July 30 stopped 63 trucks and conducted 32 full inspections, finding 50 violations.

The checkpoint resulted in seven drivers and five vehicles being placed out of service. Officers also found six commercial driver’s license violations, four seat belt violations, two drug or alcohol violations and one license suspension.

New York targets toll evasion and bridge strikes

New York State Police recently conducted separate commercial vehicle operations targeting unsafe trucks, toll evasion and bridge strikes.

During an enforcement detail on Saturday at the Gov. Mario M. Cuomo Bridge, state authorities conducted 33 inspections during the operation and placed more than a half-dozen vehicles out of service for safety violations. 

Inspectors also documented 118 non-out-of-service violations involving equipment, permits and registrations.

Another New York enforcement campaign focused specifically on preventing commercial trucks from striking bridges and overpasses.

State police conducted the Bridge Hit Mitigation Enforcement Campaign July 26-30 in partnership with the New York State Department of Transportation and Governor’s Traffic Safety Committee.

Troopers conducted 48 commercial vehicle inspections on Long Island, placing four vehicles out of service and issuing 67 traffic tickets.

British Columbia operation puts nearly half of inspected trucks out of service

Commercial vehicle inspectors in British Columbia placed 11 of 24 inspected trucks out of service during a multiagency enforcement operation in Delta.

The Delta Police Department’s Commercial Vehicle Enforcement Unit’s initiative was part of the Commercial Vehicle Safety Alliance’s Operation Safe Driver Week, which targets risky driving behaviors such as speeding and distracted driving.

Officers conducted 24 inspections, documenting 116 violations and issuing 33 tickets. Eleven vehicles — about 46% of those inspected — were placed out of service.

Violations included distracted driving, speeding, seat belt infractions, insecure cargo, overweight vehicles and defective brakes.

Inspectors said one semi-truck had a severely damaged steering tire and defective brakes that had not been identified during the driver’s required pre-trip inspection.

Saskatchewan truck caught hauling 24,000 kilograms of corrosive liquids

A commercial vehicle inspection in Saskatchewan, British Columbia, Canada, uncovered a truck illegally transporting 24,000 kilograms — nearly 53,000 pounds — of corrosive liquids.

Royal Canadian Mounted Police Traffic Services stopped the semi-truck on Highway 13 near Ponteix in July.

An investigation with the Saskatchewan Highway Patrol found that the British Columbia-based trucking company was not permitted to transport dangerous goods and that the driver wasn’t trained or certified to operate a vehicle carrying dangerous goods.

Authorities also said the truck did not display a placard identifying the dangerous cargo.

The driver was charged with obstruction of a peace officer and received multiple commercial vehicle-related violations.

Recent commercial vehicle enforcement actions

LocationInspections/stopsViolationsDrivers OOSVehicles OOSOther enforcement
Arizona67 inspections280201547 citations; 3 unpermitted wide loads
Nebraska — Platte County35 inspections15131416 citations
Nebraska — Douglas County63 trucks stopped; 32 inspections50758 tickets; 6 CDL violations
New York — Cuomo Bridge33 CMV inspections118 non-OOS CMV violationsMore than 6303 total tickets; 28 vehicles impounded
New York — Bridge Hit campaign48 inspections467 traffic tickets
British Columbia24 inspections1161133 tickets
Saskatchewan1 truck detailedMultipleDriver charged; 24,000 kg of corrosive liquids discovered
Recent commercial enforcement actions in Arizona, Nebraska, New York and Canada found over hundreds of violations.

Why it matters: The latest enforcement actions show commercial vehicle regulators across the U.S. and Canada intensifying scrutiny of truck and driver safety, with inspections increasingly targeting driver qualifications and operating practices alongside traditional equipment violations.