
Major weather events such as hurricanes, blizzards, and historic flooding can produce immediate volatility as well as lasting effects on supply chains, depending on where they hit. Besides the obvious results of every day/short-term weather – possible shutdowns of local/ regional supply chains and potential closures of roads, businesses and government offices – intense and long-term weather events have a bigger effect on supply, demand and freight rates. There’s often a rush for truckers to get freight out of areas that are about to get hit by a significant storm.
This can drive down spot rates that carriers charge because they need their drivers to get out of these areas quickly with freight. Rebuilding after a destructive hurricane leads to a surge of inbound shipments of lumber and other materials into the affected markets, often resulting in spot rate increases due to higher demand. After historic flooding – like that in the Midwest and Great Plains this year which lasted for months – locks may be closed, preventing barges carrying grains and other commodities from reaching coastal areas for export. Instead, they have to be shipped by truck or rail. Depending on capacity, this will increase or decrease spot rates.
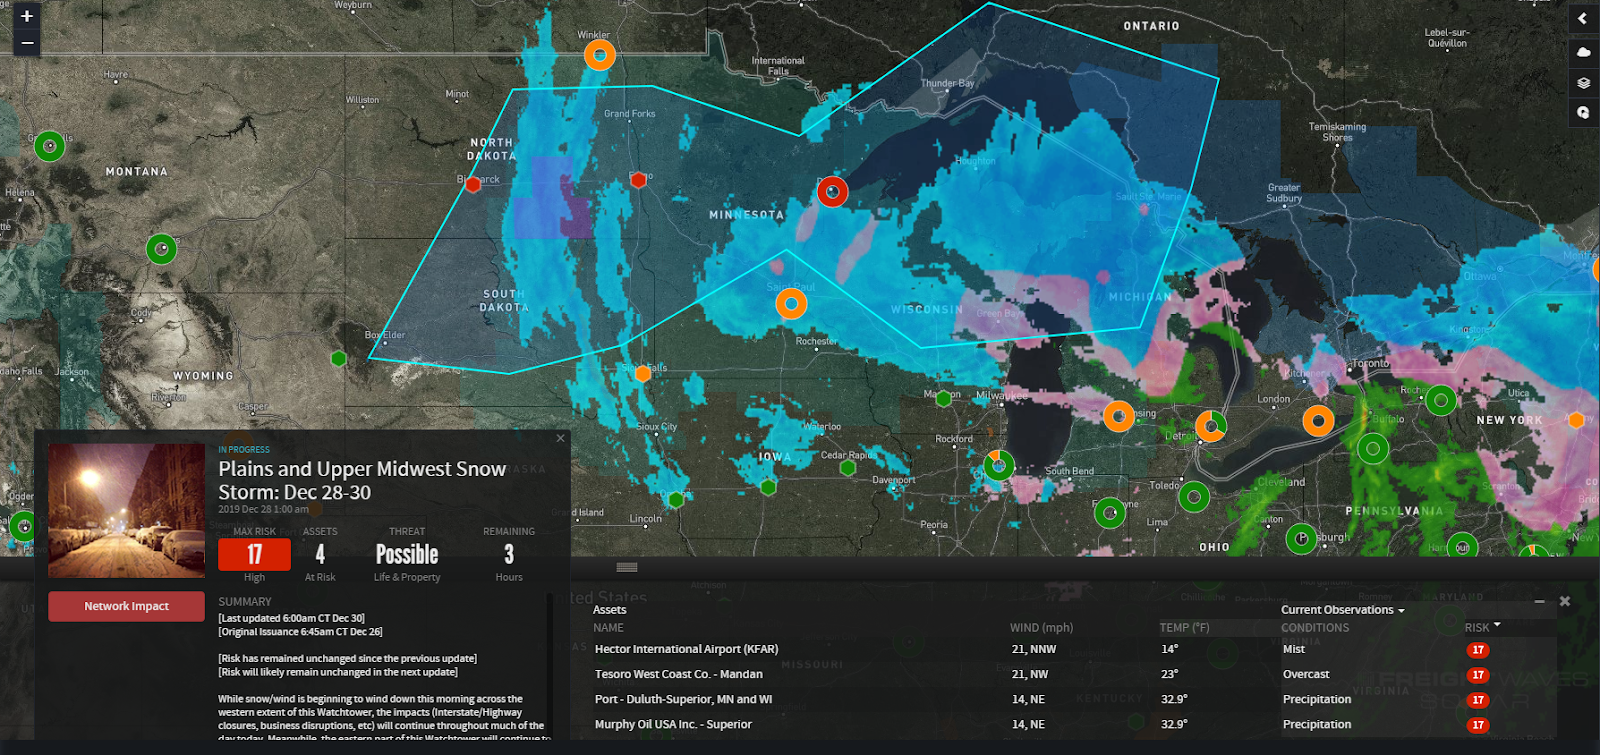
SONAR Critical Events and radar from Monday, December 30, 2019, 10 a.m. EST.
Wind: High wind is one of the toughest things Mother Nature can throw at truckers.. Compared to small box trucks and flatbeds, dry vans and reefers are most prone to blow-overs because of their large surface areas. When hauling an empty trailer, the danger only increases due to the lack of added weight to prevent the trailer from jackknifing. Crosswinds – those that are perpendicular to the trailer – are the most dangerous, but strong headwinds can also reduce fuel efficiency and increase operating costs.
There is no hard and fast rule that says a specific wind speed is most dangerous, but many professional drivers have said that anything over 60 mph is too risky. Wind speeds between 40 mph and 59 mph can be trouble depending on your load weight, and gusts often pose a greater threat than sustained winds. The American Meteorological Society (AMS) defines a gust as “a sudden, brief increase in speed of the wind,” adding “gusts are reported when the peak wind speed reaches at least 16 knots (18.4 mph) and the variation in wind speed between the peaks and lulls is at least 9 knots (10.4 mph). The duration of a gust is usually less than 20 seconds.” Keep in mind that a trailer does not have to be moving to be damaged. A strong enough wind gust can damage a trailer sitting in a parking lot.
Professional drivers are taught how to anticipate and handle most types of weather with the only exceptions being those conditions they can’t see. These are the most life-threatening ones and include ice and white-outs.
- Ice: The riskiest road surface condition for drivers is without doubt black ice, which often forms in the early hours of the morning when drivers are the most tired and least alert. Icy roads can also form when the air temperature is below 32 degrees Fahrenheit or when low ground temperature causes precipitation to freeze upon impact.
- Whiteouts: When drivers of all vehicle types lose visibility at speed, chaos usually ensues. Pile-ups are very common outcomes blocking interstates for days and disrupting supply chains in the process. Whiteouts occur when the sky and snow are of a similar whiteness making the horizon difficult or impossible to see
FreightWaves solutions:
SONAR Critical Events is a highly effective tool for shippers, brokers, carriers and drivers to get ahead of Mother Nature. Impact regions are highlighted days in advance of major weather events. Costly disruptions in freight movement can occur on rails, runways and intermodal ramps, not just on roads. Within a potential impact region, Critical Events color codes assets such as airports, sea ports and railroads based on threat level, and indicates how long the threat will last. Overlays of radar, temperature, precipitation and wind forecasts, National Weather Service warnings, DOT traffic information and forecast road conditions complete the picture. Critical Events, along with SONAR’s vast freight market data, can help anyone in the freight transportation industry make better re-routing decisions regarding driver safety and their bottom lines.
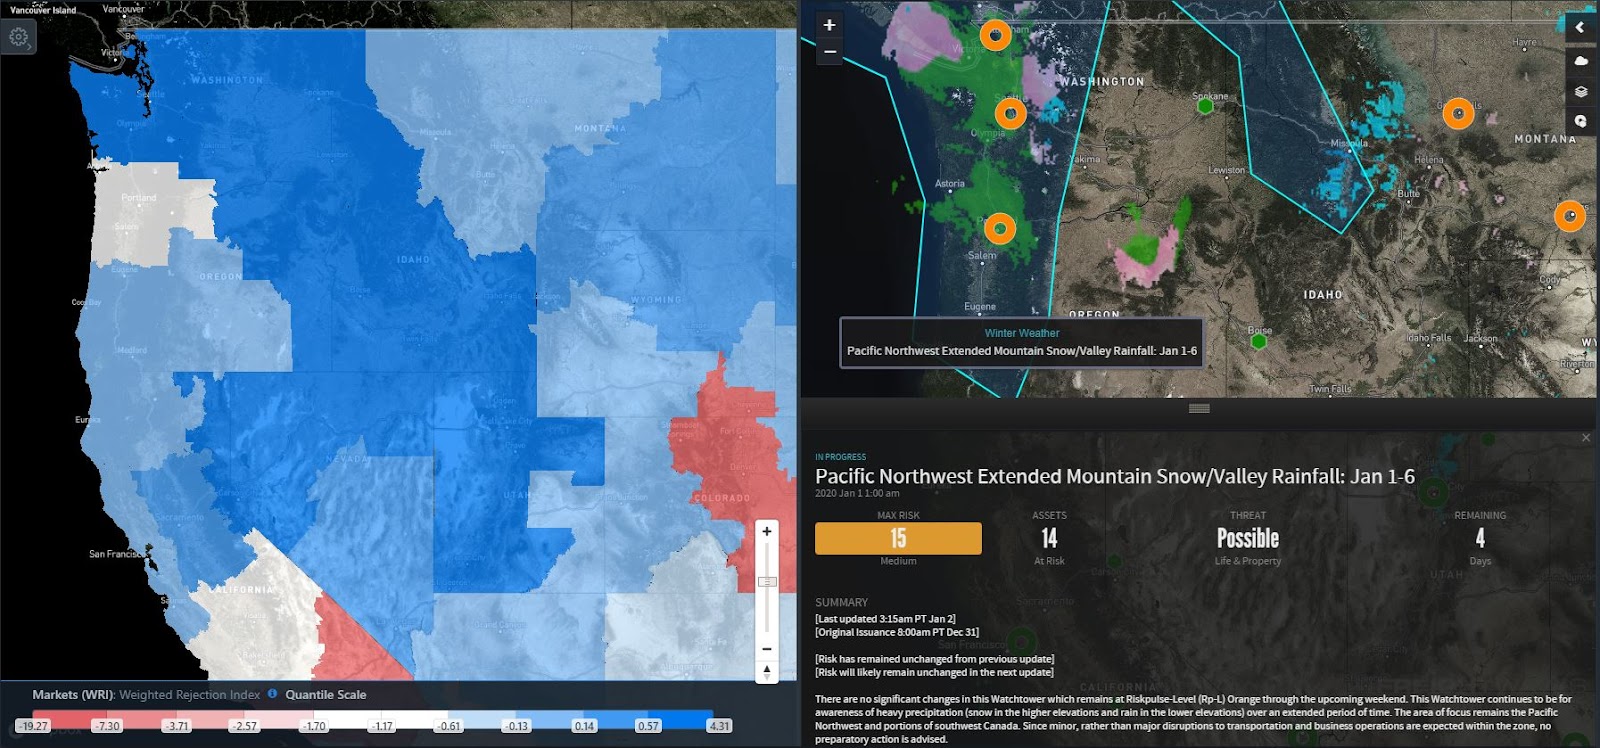
In the SONAR case illustrated in the map above, carriers could use the Weighted Rejection Index (WRI) to see that capacity in many Northwest markets is tightening, while volumes are increasing. This is indicated by the blue shading. Carriers may be able to send drivers to markets just outside the impending weather’s impact zones where freight is becoming more available. WRI is a combination of market share – a market’s outbound volume compared to the rest of the country – and weekly change in tender rejection rate – the percentage of electronically offered loads from shippers that have been turned down by carriers for any number of reasons. This gives the most updated, accurate look at market volatility.