
This week’s FreightWaves Supply Chain Pricing Power Index: 40 (Shippers)
Last week’s FreightWaves Supply Chain Pricing Power Index: 40 (Shippers)
Three-month FreightWaves Supply Chain Pricing Power Index Outlook: 35 (Shippers)
The FreightWaves Supply Chain Pricing Power Index uses the analytics and data in FreightWaves SONAR to analyze the market and estimate the negotiating power for rates between shippers and carriers.
This week’s Pricing Power Index is based on the following indicators:
Volumes see weekly gains at last minute
For most of the past week, freight demand was flagging as many of the heavyweight markets saw serious contractions in volume. These losses undid the marginal gains seen in the last few weeks of October. Needless to say, this dip is not seasonable but is rather indicative of the truckload market’s prolonged deterioration. While there might be some bright spots concerning consumer activity in 2022’s holiday season, it remains unclear if this will have an appreciable effect on over-the-road volumes.

SONAR: OTVI.USA: 2022 (white), 2021 (green) and 2020 (orange)
To learn more about FreightWaves SONAR, click here.
This week, the Outbound Tender Volume Index (OTVI) rose by a slim 0.74% on a week-over-week (w/w) basis. On a year-over-year (y/y) basis, OTVI is down 27.9%, although y/y comparisons can be colored by significant movements in tender rejections. OTVI, which includes both accepted and rejected tenders, can be artificially inflated by an uptick in the Outbound Tender Reject Index (OTRI).

SONAR: CLAV.USA: 2022 (white), 2021 (green) and 2020 (orange)
To learn more about FreightWaves SONAR, click here.
Contract Load Accepted Volume (CLAV) is an index that measures accepted load volumes moving under contracted agreements. In short, it is similar to OTVI but without the rejected tenders. Looking at accepted tender volumes, we see a rise of 1.29% w/w but also a fall of 14.85% y/y. This y/y difference confirms that actual cracks in freight demand — and not merely OTRI’s y/y decline — are driving OTVI lower.
In early November, the National Retail Federation (NRF) issued an optimistic forecast for the 2022 holiday spending season. Even if the NRF’s optimism should prove justified by consumer resilience, it remains an open question whether holiday retail sales will outpace inflation. Elevated prices continue to be passed down to consumers from suppliers, leading the Federal Open Market Committee (FOMC) to raise interest rates by an additional 75 basis points at its November meeting.
The FOMC is responding to incredibly mixed signals from the economy, not least of which are figures from the labor market. Per last week’s release of the monthly jobs report, 261,000 nonfarm jobs were added in October, considerably above consensus expectations of 195,000 but less than September’s revised growth of 315,000 jobs. Yet the rate of unemployment rose 20 bps in October to 3.7%, with the number of unemployed persons rising by 306,000 over last month.
It might seem strange that, on the one hand, a net 261,000 nonfarm jobs were added while, on the other hand, a net 306,000 jobs were lost. These two figures come from two separate surveys: the Establishment and Household Surveys, respectively. Many methodological differences exist between the two data sets. One notable difference is that the Household Survey counts the employment status of each individual, while the Establishment Survey counts each job. In short, job growth figures in the Household Survey do not account for employees working at multiple positions, while the Establishment Survey counts each new payroll as job growth, whether or not it was gained by someone already employed elsewhere.
This difference between the two surveys is significant, as the Household Survey reported a staggering 510,000 rise in multiple jobholders from September to October. This data suggests that, while fewer individuals are working overall, many people are now holding more than one position. This rise in multiple jobholders betrays a clean picture of a red-hot labor market driving inflationary pressures.

SONAR: Outbound Tender Volume Index – Two-Week Change (OTVIF).
To learn more about FreightWaves SONAR, click here.
Of the 135 total markets, 75 reported weekly increases in tender volume as freight demand hit regions with inconsistency.
The market of Ontario, California, which is largely responsible for over-the-road distribution of imports that come into the nearby ports of Los Angeles and Long Beach, has been seeing its volumes evaporate for a handful of weeks. Given that, according to U.S. Customs data, import volumes at the Port of Los Angeles averaged down 4.74% m/m in October, it should be no surprise that freight demand in Ontario is down 0.83% w/w.
By mode: Dry van volumes are once again the primary driver behind the rise in the overall OTVI, outweighing the slight depression in reefer volumes. The Van Outbound Tender Volume Index (VOTVI) is up 0.81% w/w. Despite VOTVI being down 28.16% y/y, the bulk of this difference stems from rapidly declining tender rejections over that same period. Accepted van volumes are nevertheless down 15.44% y/y.
The Reefer Outbound Tender Volume Index (ROTVI) did slide 0.25% w/w, with many of the major reefer markets — such as Atlanta and Lakeland, Florida — seeing losses in reefer demand. Like VOTVI, ROTVI is down by a severe 34.15% y/y. Unlike accepted dry van volumes, however, accepted reefer volumes are actually up 1.67% y/y.
Rejection rates stumble to new floor
OTRI has been bounded between 4% and 5% since mid-October and is threatening to fall below 4%, reaching a new cycle low. When OTRI was bounded between 5% and 6%, it took two months to break through that floor. Should OTRI fall below 4% in the coming days, this period of yo-yoing will be resolved in half the time. Keep in mind that OTRI continues to be well below 2019’s average of 6.08% and is edging nearer to 2019’s yearly low of 3.78% — a figure that should be considered the data set’s floor.

SONAR: OTRI.USA: 2022 (white), 2021 (orange) and 2020 (green)
To learn more about FreightWaves SONAR, click here.
Over the past week, OTRI, which measures relative capacity in the market, fell to 4.1%, a change of 52 bps from the week prior. OTRI is now 1,538 bps below year-ago levels.
The October print of the Logistics Managers’ Index (LMI) unsurprisingly reported that transportation capacity is loosening at the quickest pace in the survey’s history. The headline LMI fell 3.9 points from the previous month to 57.5. This latest reading puts the index not only below the all-time average of 64.9 but also right in line with 2019’s average of 57.5. As mentioned several times in this column, comparisons between the current market and that of 2019 are less than auspicious, to put it mildly.

SONAR: WRI (color)
To learn more about FreightWaves SONAR, click here.
The map above shows the Weighted Rejection Index (WRI), the product of the Outbound Tender Reject Index — Weekly Change and Outbound Tender Market Share, as a way to prioritize rejection rate changes. As capacity is generally finding freight, a few regions this week posted blue markets, which are usually the ones to focus on.
Of the 135 markets, 41 reported higher rejection rates over the past week, though 31 of those reported increases of only 100 or fewer bps.
Rejection rates in Atlanta, the largest market by outbound volume, are ticking up after the city’s local OTRI hit its cycle low of 3.13% last week. While the market’s OTRI did rise 72 bps w/w, rejection rates are a far cry from the high of 13% seen over the summer. A similar trend took place in Ontario, California, which saw a cycle low of 1.71% in mid-October. Ontario’s OTRI did rise 74 bps w/w to 2.61%, but this gain is relatively insignificant given that the market’s rejection rates are roughly one-third lower than the national average.
To learn more about FreightWaves SONAR, click here.
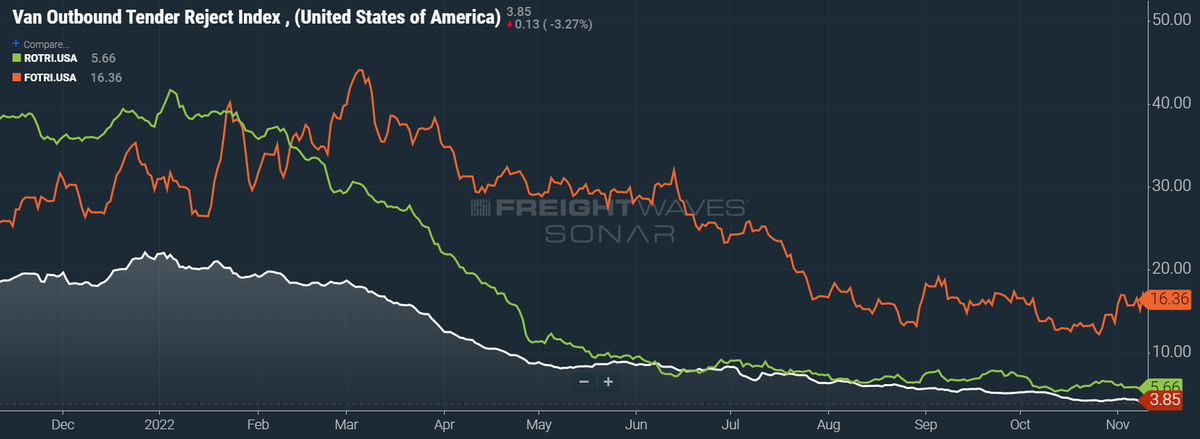
By mode: Despite falling on a w/w basis, flatbed rejection rates are a bright spot for carriers. Although there are few remaining sources of upward pressure on the Flatbed Outbound Tender Reject Index (FOTRI), since residential construction has largely dried up and domestic manufacturers struggle with deep-rooted pessimism, FOTRI has nevertheless gained some distance from last month’s cycle low of 12.2%. Over the past week, FOTRI lost 55 bps w/w and fell to 16.36%.
Dry vans and reefers are in a comparatively worse condition. The Van Outbound Tender Reject Index (VOTRI) fell 61 bps to 3.85%, while the Reefer Outbound Tender Reject Index (ROTRI) dipped 14 bps to 5.66%. Reefers could see elevated demand during the winter, as cold weather will shift dry goods sensitive to volatile swings in temperature to a climate-controlled environment.
Elevated diesel prices not boosting spot rates
Since losing the inconsistent gains of early October, spot rates have yet to recover. Rising diesel prices, the nationwide average of which is now at $5.33 per gallon, can only do so much to offset waning linehaul spot rates. While it seemed earlier that spot rates were yo-yoing near what looked to be their local floor, it is abundantly clear they have room to fall further.

SONAR: National Truckload Index, 7-day average (white; right axis) and dry van contract rate (green; left axis).
To learn more about FreightWaves SONAR, click here.
This week, the NTI, which includes fuel surcharges and other accessorials, fell 3 cents per mile w/w to $2.56. Since diesel prices began October under $4.85 per gallon and have shot up more than 50 cents since then, continued declines in the NTI are troubling. In fact, it is doubly concerning as the NTI is approaching 2019’s average of $2.06 per mile, a figure that, after adjusting for inflation, approximates $2.41 per mile.
As should be expected, the NTI’s losses can be attributed to weakening linehaul spot rates. The linehaul variant of the NTI (NTIL), which excludes fuel surcharges and other accessorials, similarly fell 3 cents per mile w/w to $1.73.
While not quite having returned to levels set at the beginning of October, contract rates — which are reported on a two-week delay — are taking a breather from losses seen later in the month. At present, this upward movement of contract rates mirrors the slight gains that spot rates saw at the end of October that were quickly undone. Contract rates, which exclude fuel surcharges and other accessorials like the NTIL, rose 2 cents per mile to $2.69.

To learn more about FreightWaves SONAR, click here.
The chart above shows the spread between the NTIL and dry van contract rates, showing the index has continued to fall to all-time lows in the data set, which dates to early 2019. Throughout that year, contract rates exceeded spot rates, leading to a record number of bankruptcies in the space. Once COVID-19 spread, spot rates reacted quickly, rising to record highs on a seemingly weekly basis, while contract rates slowly crept higher throughout 2021.
As the linehaul spot rate remains 95 cents below contract rates, there is still runway for contract rates to decline throughout the next six months.

To learn more about FreightWaves TRAC, click here.
The FreightWaves TRAC spot rate from Los Angeles to Dallas, arguably one of the densest freight lanes in the country, seems close to bottoming out. Over the past week, the TRAC rate fell 6 cents per mile w/w to $2.46. The daily NTI (NTID), which has risen to $2.60, is comfortably outpacing rates from Los Angeles to Dallas.

To learn more about FreightWaves TRAC, click here.
On the East Coast, especially out of Atlanta, rates did rise slightly but are nevertheless underperforming against the NTID. The FreightWaves TRAC rate from Atlanta to Philadelphia gained 1 cent per mile this week to settle at $2.47. Rates along this lane have been dropping stepwise since mid-July, when the TRAC rate was $3.48 per mile.
For more information on the FreightWaves Passport, please contact Kevin Hill at khill@www.freightwaves.com, Tony Mulvey at tmulvey@www.freightwaves.com or Michael Rudolph at mrudolph@www.freightwaves.com.
Supply Chain AI Symposium
Past the hype. Join operators, founders, and enterprise leaders figuring out how to deploy AI in supply chain.
F3: Future of Freight Festival
Industry-defining keynotes, rapid-fire technology demos, and industry leaders networking in experiences across Chattanooga - plus the inaugural F3 Awards Dinner featuring the FreightTech and Shipper of Choice reveals.
Past the hype. Join operators, founders, and enterprise leaders figuring out how to deploy AI in supply chain.
The Old Post • Chicago, IL Register NowIndustry-defining keynotes, rapid-fire technology demos, and industry leaders networking in experiences across Chattanooga - plus the inaugural F3 Awards Dinner featuring the FreightTech and Shipper of Choice reveals.
The Signal at Chattanooga Choo Choo • Chattanooga, TN Register Now