




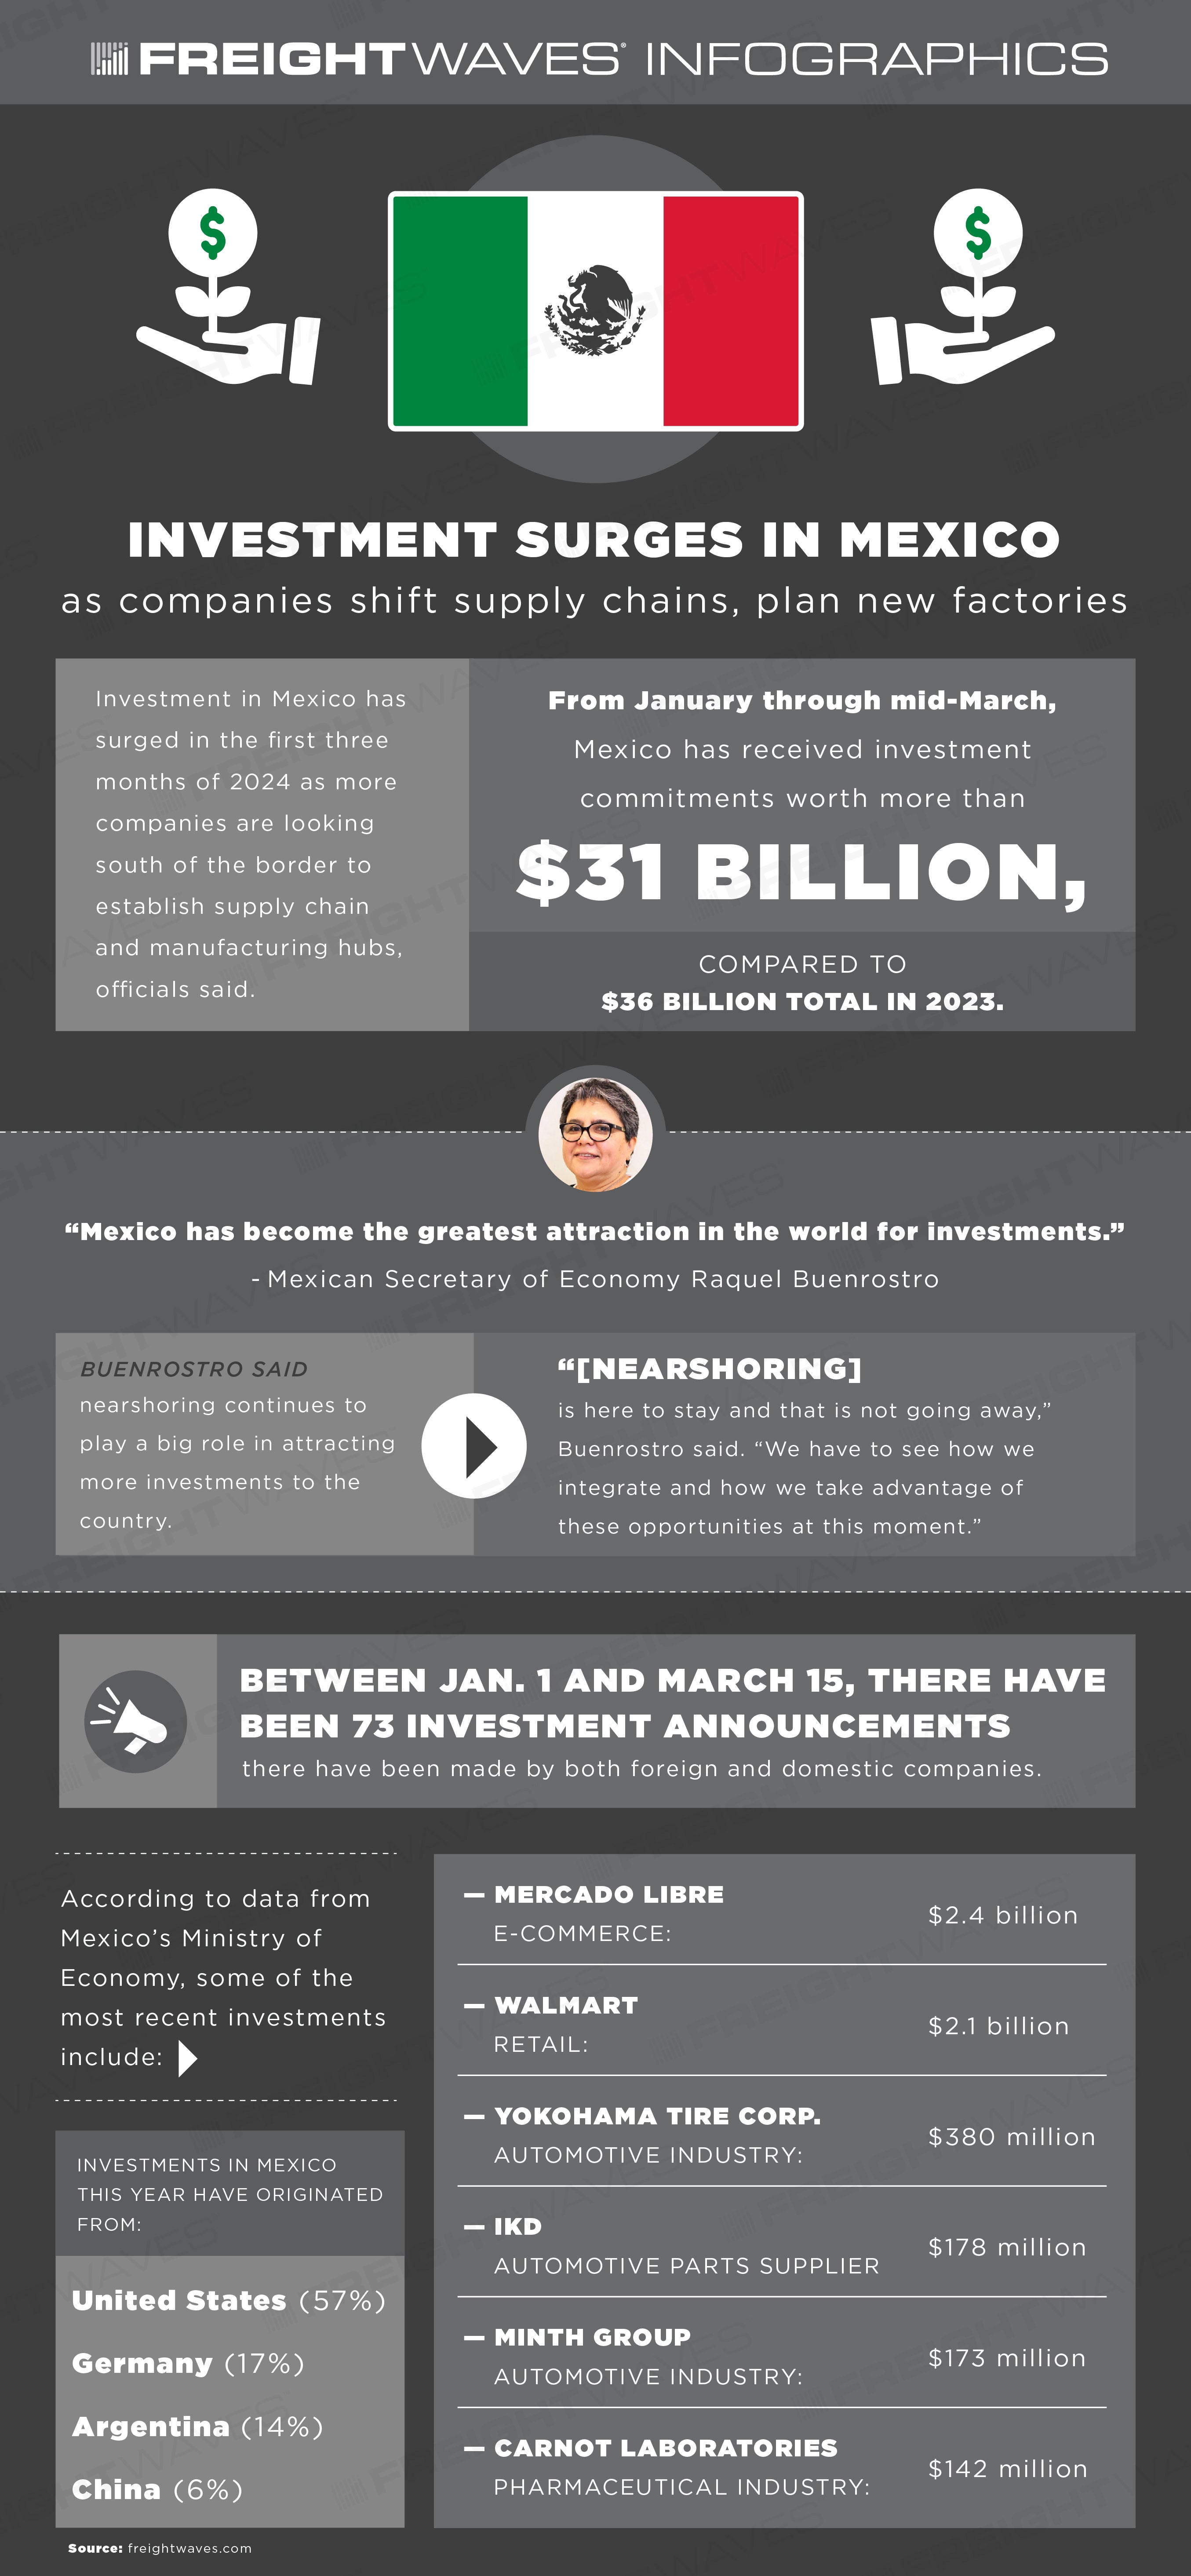
FreightWaves Infographics: Investment surges in Mexico as companies shift supply chains, plan new factories

As the days add up after the March 26 collapse of the Francis Scott Key Bridge, companies that gather data from trucks and supply chains are beginning to get an idea of where trucks are rerouting in the catastrophe’s wake. Data on ship rerouting is less conclusive.
While some of that data is clear, a lot remains murky as shippers and carriers figure out how to loosen the logistical choke points the collapse created.
One of the clearest data series in the market, because it is fed by decisions that need to be made that very day, is what routes trucks making their way through the Baltimore area are using instead of the Key Bridge, which crosses the eastern mouth of the Baltimore Inner Harbor where it meets Chesapeake Bay.
Rishi Mehra, vice president of the Maps division of telematics company Trimble (NASDAQ: TRMB), has reviewed customer data on where trucks are rerouting away from the Key Bridge, which was on the eastern side of the Interstate 695 loop around Baltimore. So far, trucks are doing pretty much what everybody expected.
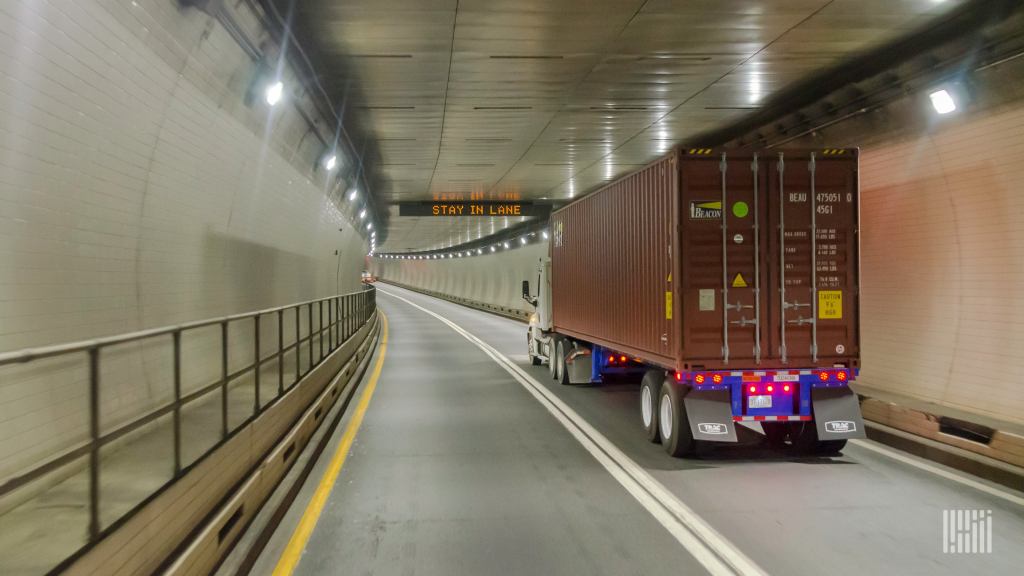
Mehra, in an interview with FreightWaves, said the largest diversion has seen traffic increase in the Fort McHenry Tunnel on Interstate 95 that travels under the more northern part of the Port of Baltimore. Behind that for diversions is the Baltimore Harbor Tunnel, whose route is slightly south of the Fort McHenry Tunnel but is only two lanes. Mehra said that is likely a reason why it has seen a lesser increase in truck traffic. Truckers might see the two-lane approach with walls on both sides as tight, he added.
“What we are looking for is to see increased traffic coming out of the other ports,” Mehra said. That data would be able to show how many power units have been shifted out of Baltimore and to what areas.
Trimble data has not spotted any significant pickup in other routing that might be increasing in frequency as a result of the closure. “There’s nothing out of the ordinary right now,” Mehra said.
The diversions being recorded by Trimble are for trucks that aren’t pulling hazardous materials. Trucks with hazmat loads are rerouted all the way to the western side of Baltimore on I-695.
Mehra said Trimble’s data shows that the hazmat trips are adding 15 to 20 minutes compared to journeys that used the shorter route around the eastern side of the city and crossed the Key Bridge.
The data on truck trips through the tunnel shows that route is adding 9 to 10 miles compared to the bridge route, tacking on 11 minutes in travel time. Speeds through the tunnels are down about 5%, Mehra said.
While Mehra conceded Trimble’s data is not yet able to pick up shifts in movements of drayage truck drivers to other ports, such as Norfolk, Virginia, he said that is because “the carriers themselves are waiting for the offloading of the freight moves they’re planning.”
He discussed the dilemma for drayage drivers and companies: A company can move a drayage tractor to another port, but drivers servicing the Port of Baltimore would live in the region as well. If the driver doesn’t want to move while the port is closed, “do they have extra people who they might be able to hire on a temporary basis?” Mehra said. “So that is part of the decision-making process they are going through.” But the data on drayage moves is not yet adequate to make any definitive statement on where the capacity is headed, Mehra added.
(An additional two hours of available service time was part of a waiver granted last week by the Federal Motor Carrier Safety Administration, and it was noted in this article that the time could allow a drayage driver based in Baltimore to service Norfolk and still be home at night.)
Gautam Jain, the CEO of India-based logistics management platform GoComet, which provides visibility into international shipments, confirmed that the data so far does not show any port picking up significant market share as a result of the closure of Baltimore.
Jain said Easter may be a part of that.
For example, since March 27, the first full day after the bridge collapse, through April 1, vessels calling at the Port of New York and New Jersey fell 25.5%, according to GoComet data. Savannah, Georgia was down 0.6%, Norfolk was up 1.5% and Charleston, South Carolina was down 22.2%.
Jain said traditionally there is heavy movement of freight just before Easter, as there is before Christmas, and that may have slowed the shift of a lot of freight away from Baltimore and to other ports.
“Easter season is over now so after a few weeks volumes will grow and then we have to see where the vessels are being diverted,” Jain said.
Data supplied by GoComet on detention also has yet to suggest any new patterns arising from by the closure of the Baltimore port.
Congestion as measured in days was 3.09 in Charleston on March 27. On Thursday, it was 2.86 days, according to GoComet.
Norfolk and Savannah congestion also fell during that time. But New York went to 3.53 days form two days, according to GoComet.
Baltimore is not a significant container port, but it is a large import location for the “ro-ro” trade, or “roll-on/roll-off.” That includes everything from automobiles to farm equipment.
“No one knows where this is going, and this is changing on a day-to-day basis,” Jain said.
Some shippers are in the dark about what is happening with their goods that have been exported to the U.S. and were ticketed for Baltimore. “So suddenly the shippers who were expecting their shipments to arrive at an inland port have to arrange for truckers at the ports of New York, Norfolk or Savannah,” Jain said. “So this is causing a lot of issues.”
More articles by John Kingston
Weak market or not, truck transportation jobs saw healthy jump in March
Drop in Class 8 truck orders in March looks big but analysts aren’t worried
Truck lease purchase deals come under heavy fire at MATS and in court
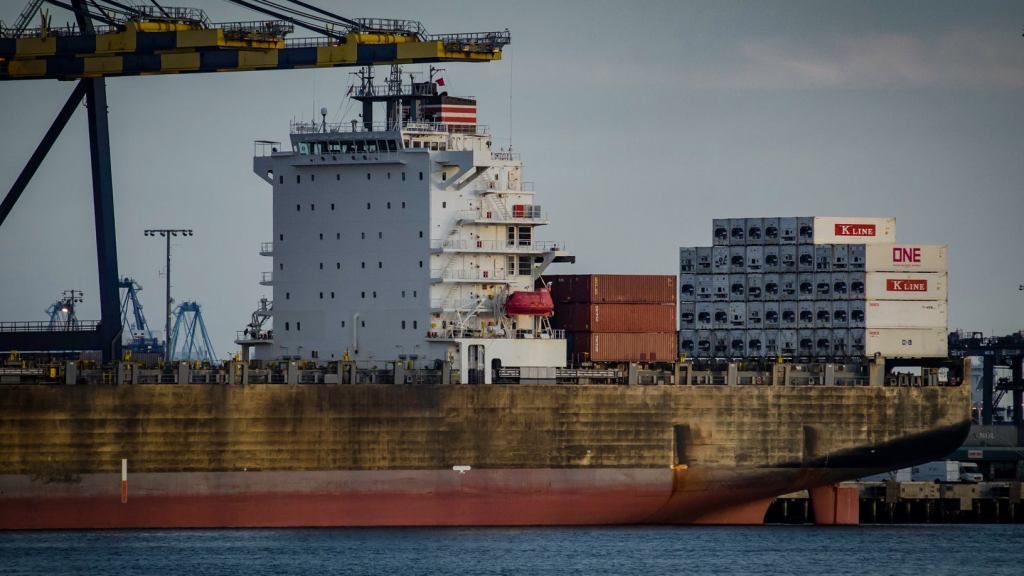
Ship recycling has fallen to its lowest level in 20 years, per a recent report by the Baltic and International Maritime Council (BIMCO).
BIMCO — a trade group representing shipowners — states that capacity has been overtaxed by the Red Sea crisis, which has forced shipping lines to take a longer route around Africa’s Cape of Good Hope. Prior to the emergence of this latest choke point, BIMCO points to the impact of Western sanctions on Russian oil and coal, which similarly stressed tanker and bulker fleets, as well as the sudden surge of consumer demand for imported goods during the pandemic, which threw a wrench into the operations of container ships.
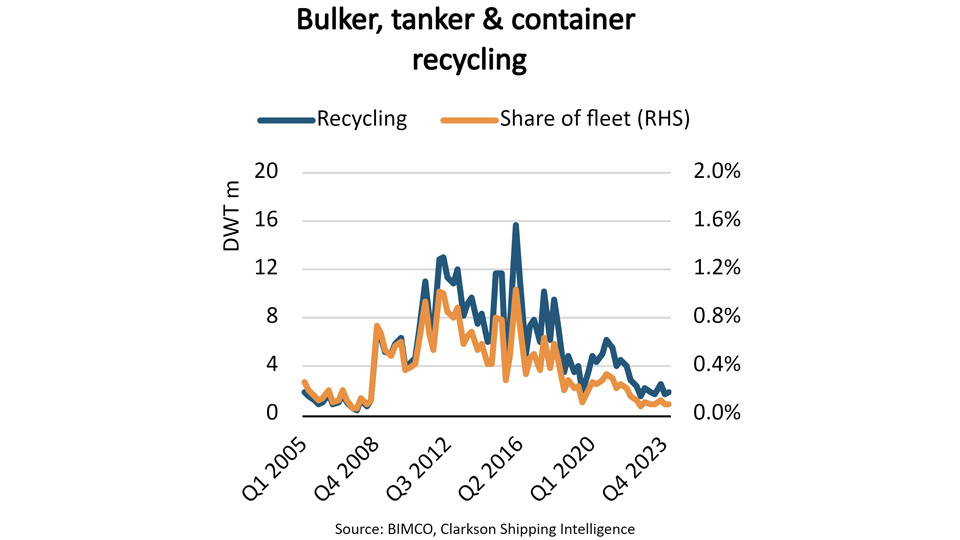
This rapid succession of upheavals has led shipowners, BIMCO argues, to delay the recycling of their oldest vessels, especially as they await the delivery of newbuilds. “During the first quarter of 2024,” the report states, “only two million deadweight tonnes (DWT) ship capacity were recycled,” the ninth consecutive quarter in which recycled capacity was below 3 million DWT.
BIMCO also notes that the last time recycling activity was this low over an extended period was in the run-up to the 2008 financial crisis. But since fleets are far larger now than they were then, the relative dearth of recycling has had an outsize effect.
Despite the geopolitical stress points that the report cites as having a dramatic effect on ship capacity, the market reality is that shipping companies have had more than enough capacity to spare throughout the recent disruptions.
Even back in January, a month in which many of the largest shipping companies exited the region, industry analysts were already downplaying the Red Sea crisis.
“The market globally is so heavily oversupplied that it has ample cover for disruptions such as this,” said Simon Heaney, senior manager of container research at Drewry. “Yes, more ships are needed to maintain weekly service. But there is ample spare capacity from the idle fleet, from the newbuilds that are coming in thick and fast, and from existing tonnage in other oversupplied trades that can be transferred across.”
With the benefit of hindsight, we can see that the impact of the Houthi attacks on global container rates was brief and limited.
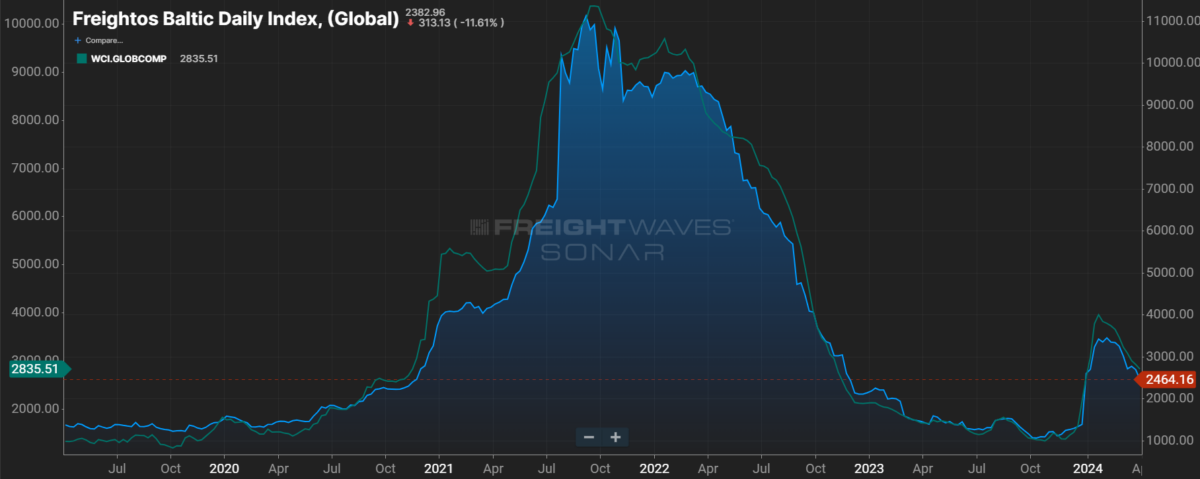
In fact, some analysts argue that the initial jolt to rates was largely aided by expected seasonal pressures, such as China’s celebration of Lunar New Year. That an escalation in Houthi attacks happened to coincide with such annual disturbances created a perfect storm for shipping rates to see short-term gains, but does not provide evidence that container lines kept aging fleets in service primarily because of recent geopolitical unrest.
“The initial shock was due to ships being in the wrong place or out of schedule,” said Philip Damas, head of Drewry’s Supply Chain Advisors. “But the second point is that the timing was really unfortunate. Ship capacity was tight because many companies were trying to import from China before the Chinese New Year closure. This timing made the bottleneck worse. There was frankly a bit of a panic in China, with everybody trying to get their containers out, and with a shortage of box equipment for exports.”
Demand for ship recycling — much like demand for aircraft — is somewhat irregular, seeing gains not on a quarterly or annual basis but once every five to 10 years. When demand does spike, however, it spikes significantly.
Take 2009, the year that followed the recycling industry’s previous lull, according to BIMCO. In 2009 alone, more than 200 vessels totaling over 370,000 twenty-foot equivalent units were scrapped. In other words, a decade’s worth of capacity was recycled in a single year.
There are numerous reasons to believe that ship recycling will see a similar surge in the not-so-distant future. BIMCO itself believes that the amount of capacity recycled between 2023 and 2033 will be double that of the decade prior.
In January 2024, the European Union began to enforce its new carbon tax system on all large ships docking at EU ports. Similarly, the International Maritime Organization has issued requirements for ships to calculate their carbon emissions and energy efficiency ratings, with the stated goal of reducing carbon intensity of all ships by 40% come 2030.
Simply put, shipping companies know that their fleets need to be modernized and more fuel-efficient, which explains why they have gone on a spending spree with much of their profits from the COVID-era boom.
In October 2023, maritime consultancy firm Clarksons reported that there were 902 newbuild container ships on order — not only an all-time high but also equivalent to 25% of companies’ extant fleets.
Once these new vessels are integrated into the fleets, ship recycling should pick up steam until it reaches a boiling point, at which time a year’s activity will likely equal that of an entire decade.

The Altamahaw, North Carolina Post Office serves ZIP Code 27202. Photo by Jimmy Emerson, some rights reserved. Photo shared under the Creative Commons License.
Altamahaw Post Office
3788 Altamahaw Church St
Altamahaw, NC 27202
Location at Google Maps
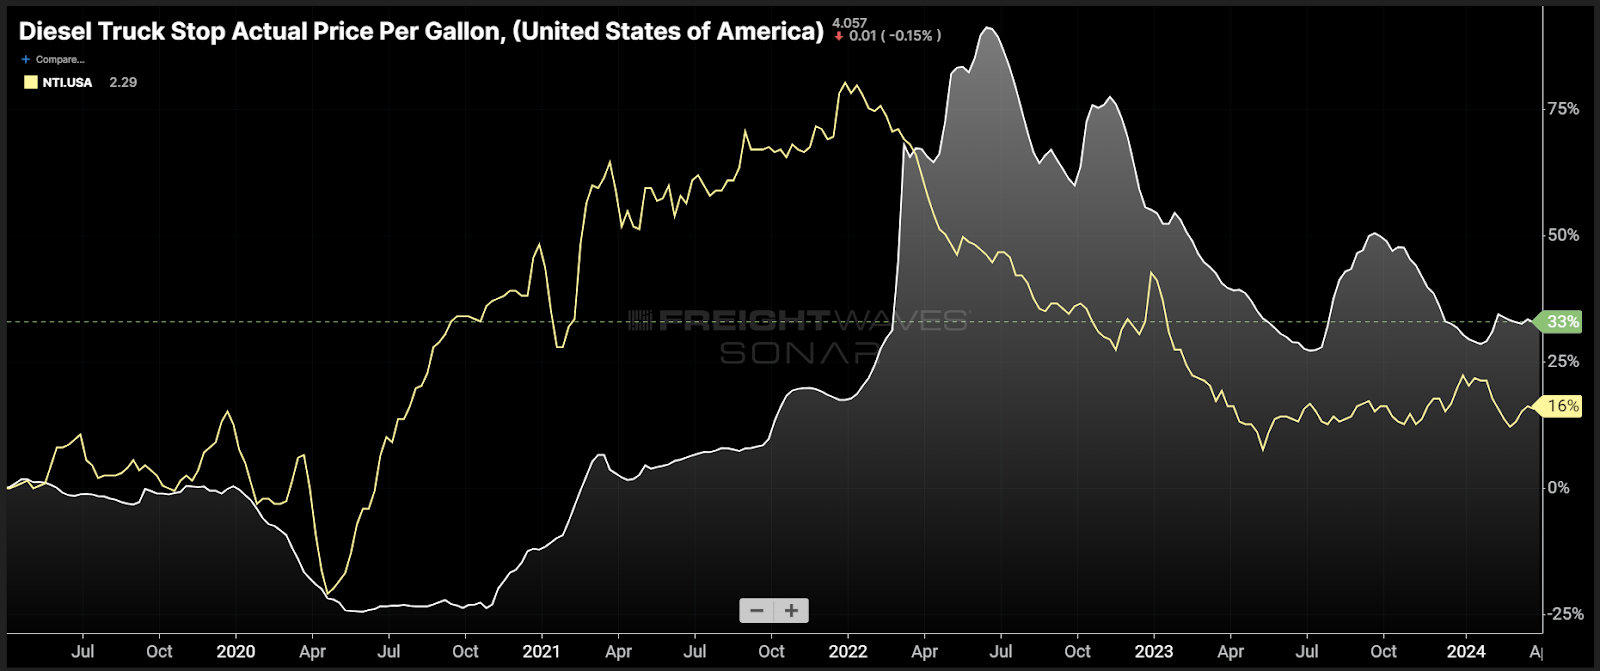
Chart of the Week: Diesel Truck Stop Actual Price Per Gallon, National Truckload Index – USA SONAR: DTS.USA, NTI.USA
Retail diesel fuel costs (DTS) are up 33% versus April 2019, while the National Truckload Index (NTI) that measures all-in spot rates are only up 16% over the same time. The implication is that carriers are in a far worse position on the spot market than they were in 2019 as they are unable to fully pass along operating costs.
Fuel is just one of many trucking operating cost inputs that have inflated dramatically over the past five years, but it is one of the largest measurable costs that are relatively homogenous across the national carrier base. It is also a glaring example of how desperate the truckload spot market has become.
Doing the math to calculate the average cost per mile based on 6.5 mpg, an industry standard that many fuel surcharges are based on, we get the outputs in the chart below:
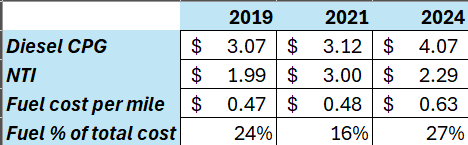
The average diesel cost per gallon and NTI values were taken from early April of each year. The cost-per-mile estimates from 2019 to 2024 may not seem that dramatic to the casual observer, but putting it in the context of what it was during a more profitable year, the swings are significant.
The full context is that 2019 and 2024 are arguably two of the softest truckload capacity environments in history; carriers had little to no pricing power. The 2021 market was nearly the exact opposite.
The fact that carriers seem to have less pricing power than in 2019 should not be taken lightly. It shows there is a level of desperation not reflected in the nominal rate, which is up 16%.
Fuel costs tend to rank second behind driver wages in terms of a carrier’s total costs. According to a 2023 ATRI report, driver wages increased 30% from 2019 to 2022. Maintenance costs were right there as well, with a 30% increase.
Point being the 16% rate increase is actually a decrease when incorporating inflated operating expenses. Adding them all together means that carriers are almost certainly losing money consistently on the spot market.
Why it matters
Unprofitability is unsustainable in a free market. That statement is not news, but the severity of the unsustainability is what should be most alarming. This environment is significantly worse than 2019 for transportation service providers.
Anyone procuring or managing transportation where long-term or contract rates are at or near spot market levels is at a severe risk of service failure if the market flips, which it will inevitably do.
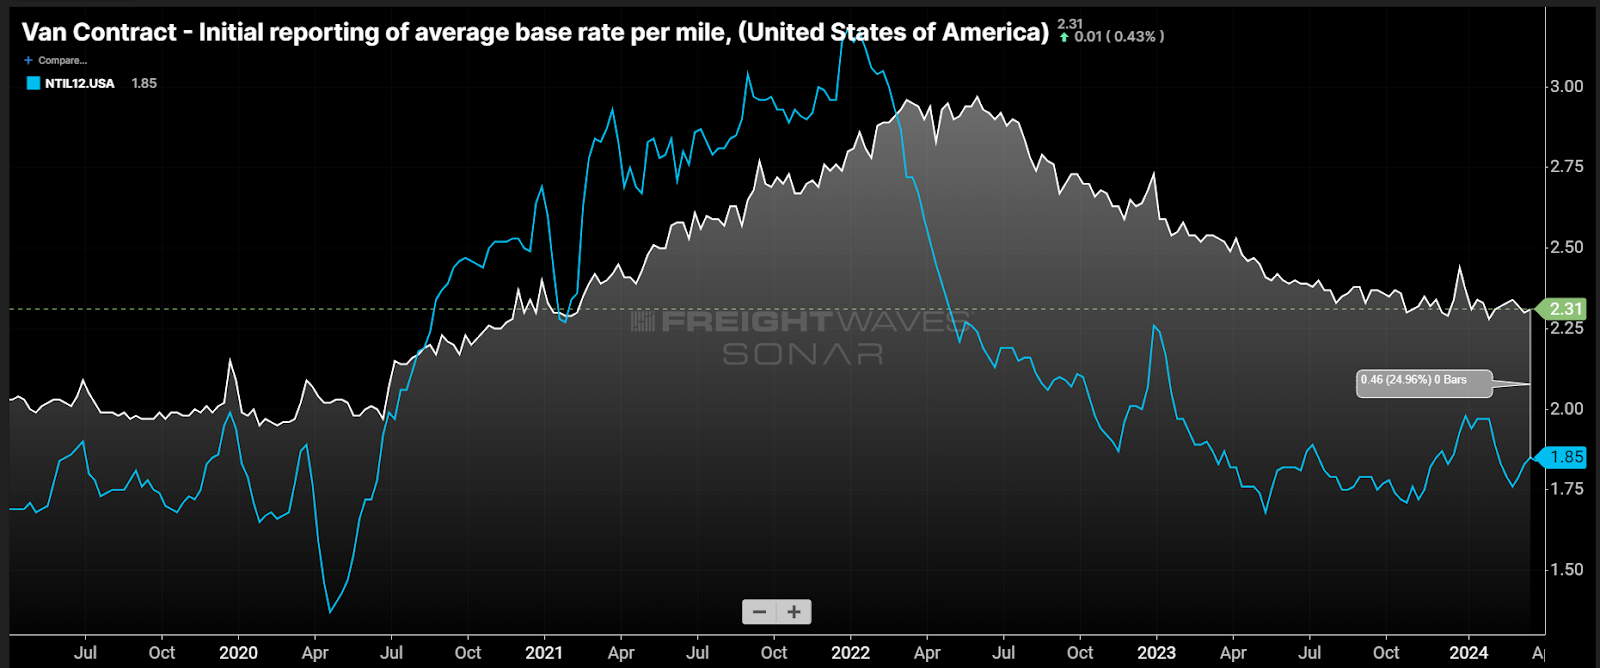
Contract base rates (VCRPM1) from SONAR’s invoice database show that contracts are roughly 25% higher than the spot market rates excluding fuel costs above $1.20 per gallon — comparable to a standard fuel surcharge — on average. The invoice data skews heavily toward the larger carrier and larger shipper contract agreement, which represents the bulk of the domestic truckload environment in the U.S.
Shippers who find their rates in line with spot rates appear to be in a good place for the near term as they enjoy significant cost savings. But it is like playing the stock market: You need to get out of that position before the market flips, or you are at risk for heavy losses in the form of service failures.
Neither shipper nor carrier/broker is to blame for the freight market volatility. It is a byproduct of a free market. Most of the participants on either side will chase dollars in a short-term play. This can be fruitful if timed well and you are actively monitoring the data at a detailed level. Participants who want a more hands-off approach need to employ a different strategy.
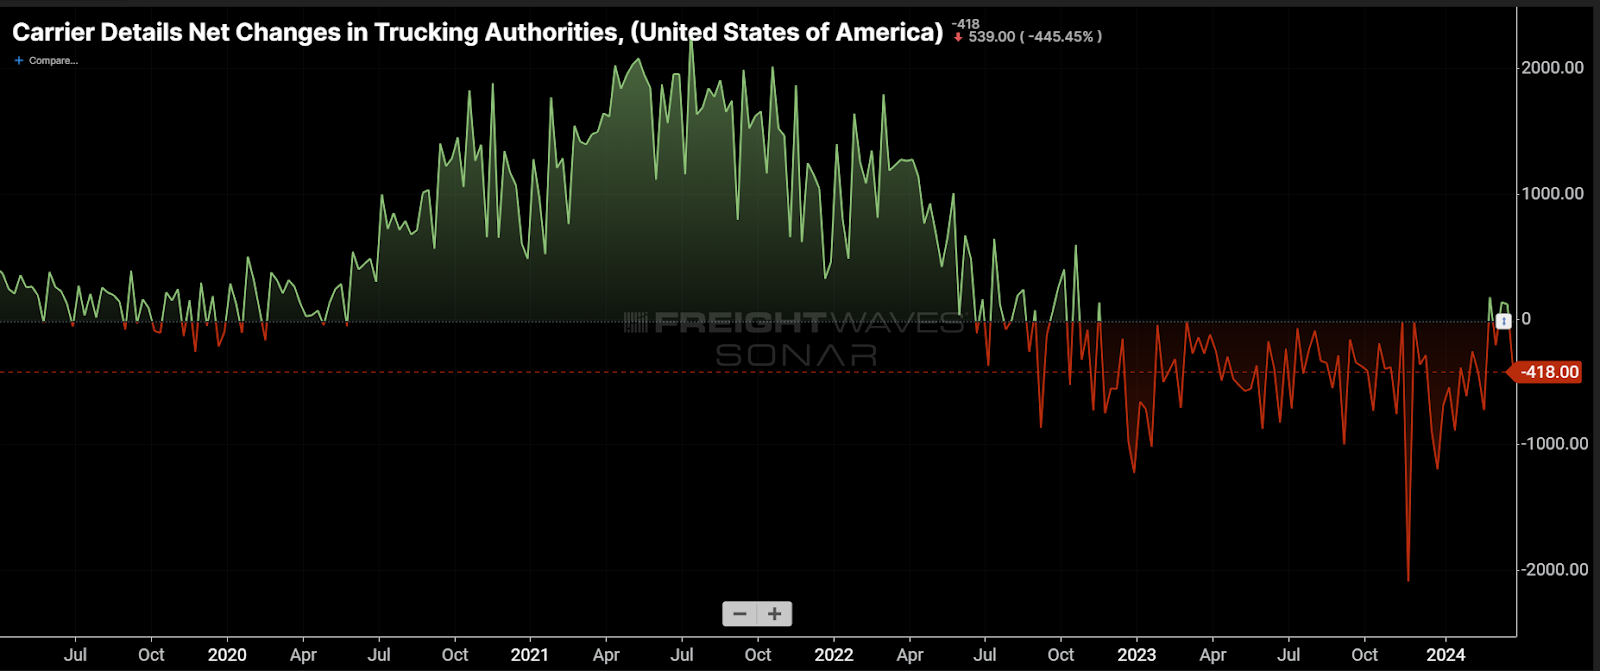
Active trucking operating authorities continue to deteriorate, another sign that the market is moving closer to equilibrium. This mechanism is very slow to manifest itself clearly and can appear with little warning.
There are no immediate signals that the market is turning at the moment. But history has shown us that it can happen nearly overnight.
Credit to SONAR Account Executive Kyle Taylor for helping identify this week’s chart.
The FreightWaves Chart of the Week is a chart selection from SONAR that provides an interesting data point to describe the state of the freight markets. A chart is chosen from thousands of potential charts on SONAR to help participants visualize the freight market in real time. Each week a Market Expert will post a chart, along with commentary, live on the front page. After that, the Chart of the Week will be archived on FreightWaves.com for future reference.
SONAR aggregates data from hundreds of sources, presenting the data in charts and maps and providing commentary on what freight market experts want to know about the industry in real time.
The FreightWaves data science and product teams are releasing new datasets each week and enhancing the client experience.
To request a SONAR demo, click here.
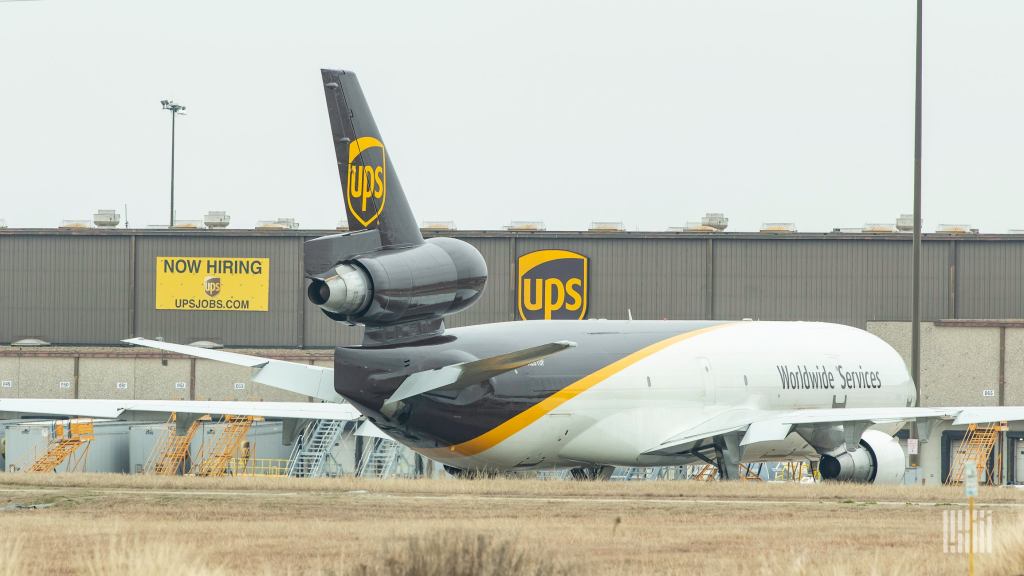
UPS is looking to hire more than 300 pilots to support an anticipated increase in air cargo demand driven by a new multi-year contract from the U.S. Postal Service, according to the union representing the company’s air crews.
“The Independent Pilots Association Executive Board was informed that UPS HR is resuming their pilot hiring process to account for the additional volume surge that will occur as the year progresses,” the union said in a statement shared with FreightWaves. “The initial projected estimate for hiring is expected to be 300+ additional crew members, which is subject to adjustment once the network plan for the additional USPS volume is finalized.”
The Independent Pilots Association is the bargaining representative for about 3,200 pilots at UPS (NYSE: UPS).
UPS beat out FedEx Express on Monday for the five-and-a-half-year Postal Service contract, which FedEx (NYSE: FDX) had held for more than 20 years. The call for pilots runs counter to initial assessments from analysts that UPS would need to add few, if any, aircraft to support the Postal Service because of its ability to lean on its high-performing linehaul truck network to move a portion of the volume. FedEx has acknowledged recent difficulties turning a decent profit on its postal business and UPS was expected to address that by running a leaner air network.
UPS also gave buyout packages last year to 193 of the most senior pilots to reduce costs amid a downturn in the parcel market.
Spokeswoman Michelle Polk confirmed UPS is recruiting 170 pilots, as currently posted on its external job boards.
The hiring number provided by the union covers the number of pilots UPS is likely to hire over the next year or so. A source familiar with pilot scheduling and staffing said UPS has to phase in new pilots because there isn’t enough capacity to train a full cohort at once.
Postal flights are primarily operated during the daytime, opposite the express overnight network.
The Postal Service has prioritized moving mail by ground as much as possible over the past three years, resulting in a $500 million reduction in revenues for FedEx during that time. FedEx realized $1.6 billion in revenue during fiscal year 2023 from its air contract with the mail agency, according to research by David Hendel, a transportation attorney at Culhane Meadows.
UPS has about 292 freighters in its mainline fleet, which is 43% smaller than FedEx’s. FedEx also has about 2,400 more pilots than UPS.
There is no indication that UPS will slow the phase out of its aging MD-11 fleet. The company last year retired six of the aircraft and plans to remove more than that amount this year. The MD-11s are being replaced by 767 freighters. UPS has 21 more 767s on order from Boeing.
(Correction: An earlier version of this story incorrectly stated FedEx’s postal revenue for fiscal year 2023 as $1.6 million instead of $1.6 billion.)
Click here for more FreightWaves stories by Eric Kulisch.
Sign up for the weekly American Shipper Air newsletter here.
Postal Service air cargo shift to UPS makes everyone a winner
UPS wins air cargo contract with Postal Service, replaces FedEx
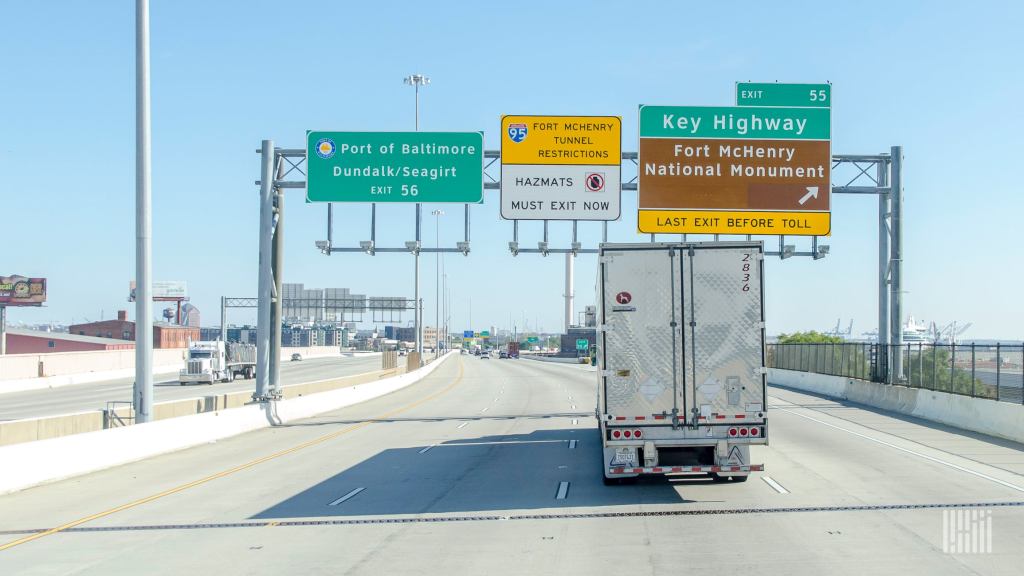
The Federal Motor Carrier Safety Administration has issued a waiver for trucking impacted by the collapse of the Francis Scott Key bridge in Maryland. Meanwhile, the outlines of a possible return to at least partial service at the port of Baltimore has been sketched out by the state’s Department of Transportation.
The FMCSA issued the waiver late Thursday night. Most prominent among the changes is adding two hours to the allowed hours of daily driving under the 14-hour on-duty limit. That current law allows 11 hours of driving in a 14-hour day; some of the key waivers granted by FMCSA will extend that by two hours.
However, it does not completely suspend Hours of Service rules, as other waivers have during other crises.
The two-hour extension will apply to “commodities rerouted from the port of Baltimore.” But the definition of commodities is broad. It includes most of the key products that had been regularly imported into Baltimore: shipping containers (though Baltimore is a relatively small intermodal port), fuel, and most importantly automobiles and other “roll-on/roll-off” commodities such as farm equipment.
On a practical basis, as Maryland Motor Truck Association President and CEO Louis Campion noted, the additional two hours can take away some anxiety for a drayage driver based in Baltimore who might need to shift their operations to the port of Norfolk while operations in Baltimore seek to resume.
“This gives him some flexibility,” Campion said in an interview with FreightWaves. A driver who had been on duty for awhile but needs more time can still take their mandatory breaks “and still feel like he can make that round trip.”
Campion said Norfolk is four to five hours away from Baltimore, depending on location.
The additional two hours extended under the HOS rules apply also to fuel deliveries coming out of the Curtis Bay terminal in the port of Baltimore. Curtis Bay is outside the part of the port blocked by the collapsed bridge. Ten Maryland areas, including the city of Baltimore, are covered by the additional two hours.
FMCSA’s waiver does lift all HOS rules on vehicles working specifically on cleanup operations at the bridge. Trucks are granted that waiver, according to FMCSA, if they are “transporting equipment and supplies related to immediate repairs to the roadways and navigable waterways,” or if they are removing debris from there.
Campion said another aspect of the FMCSA waiver is permitting drivers that are not now under an ELD mandate, such as a drayage driver that sticks to a small radius around the port, to not need to install an ELD if it ventures further from its normal area of operation. Paper logs will suffice, according to the waiver.
The waiver is effective until May 8 or the end of the emergency declared by Maryland Gov. Wes Moore, whichever is earlier. Waivers can be extended; the sweeping waiver on trucking related to COVID-19 was extended from the start of the pandemic to October 2022.
A timeline for restoration of some port service also became visible Thursday when the state’s Department of Transportation and its Port Administration laid out the first dates for when limited service to the port might be restored: late April.
According to the Port Administration’s statement, the U.S. Army Corps of Engineers believes it can open a “limited access channel” that would be 280 feet wide and 35 feet deep “within the next four weeks.”
The key comparison is with what is normal: 700 feet wide and 50 feet deep.
Not all types of freight movements would be able to access that channel, according to the statement. “This channel would support one-way traffic in and out of the Port of Baltimore for barge container service and some roll on/roll off vessels that move automobiles and farm equipment to and from the port,” it said.
Lt. Gen. Scott A. Spellmon, commanding general of the Corps of Engineers, described the timeline as “ambitious.” “Adverse” weather or additional information about “changes in the complexity of the wreckage” could change the date when the channel might be opened. ““We are working quickly and safely to clear the channel and restore full service at this port that is so vital to the nation,” he said in the statement.
Even with the good news about a partial reopening of some operations in Baltimore, Campion said that among the trucking community and the ports, the prospect of some traffic never coming back to the city remains a “huge concern.”
“There are some ocean carriers that I know have committed to coming back to Baltimore, at least verbally,” he said. “We know that freight is going to move into the country. We prefer that it moves to Baltimore and not the surrounding ports.”
More articles by John Kingston
Weak market or not, truck transportation jobs saw healthy jump in March
Drop in class 8 truck orders in March looks big but analysts aren’t worried
Truck lease purchase deals come under heavy fire at MATS and in court

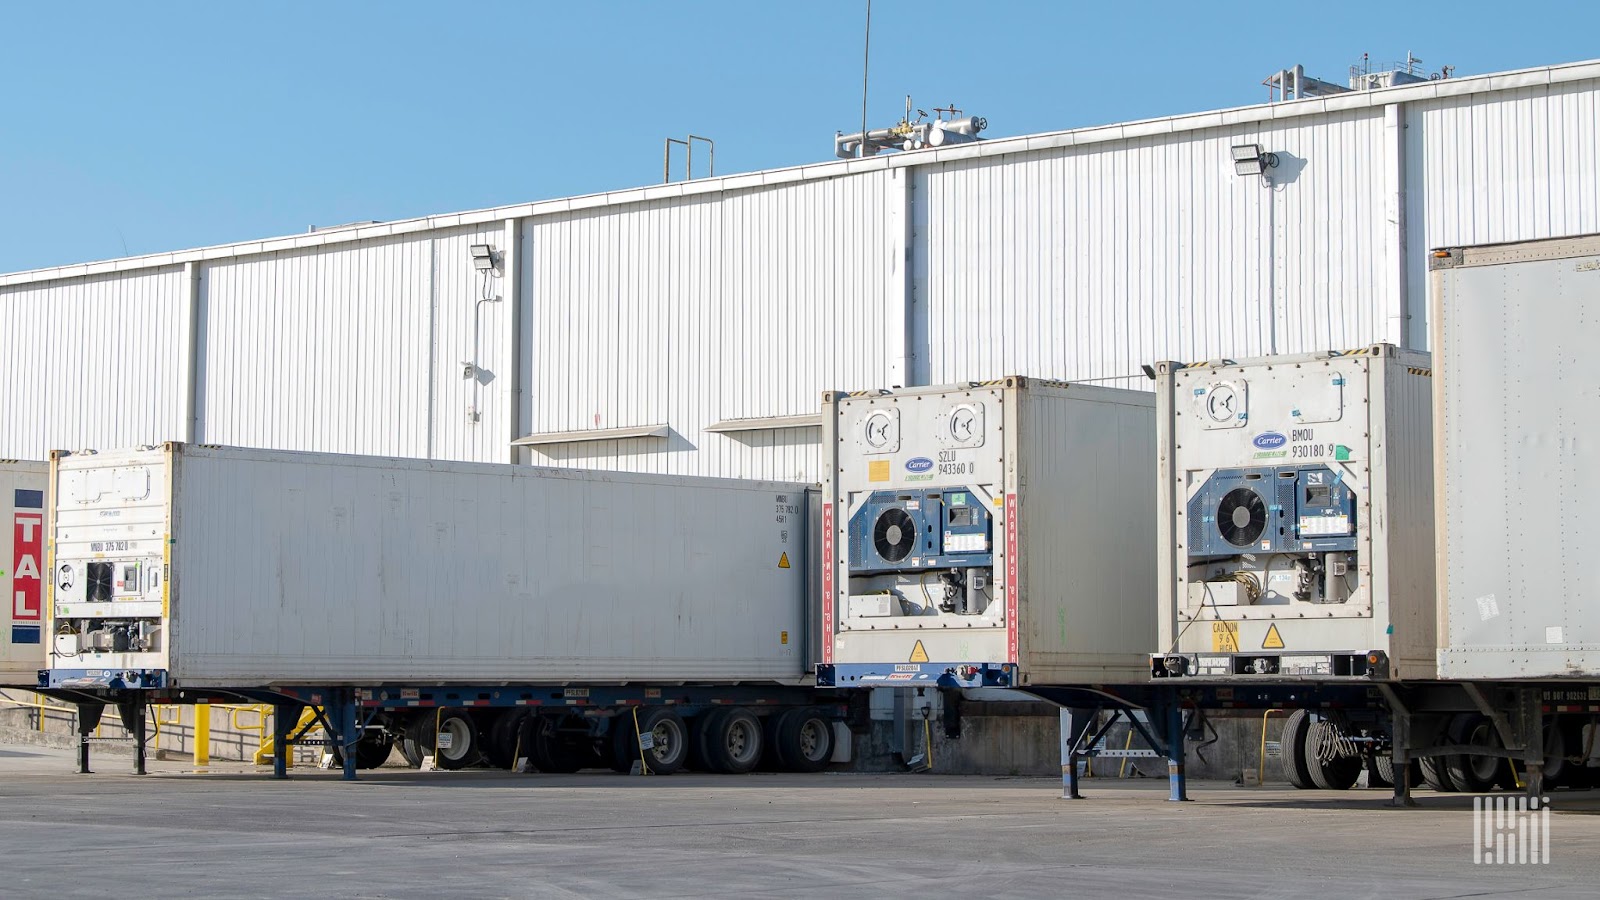
Running on Ice is doing something a little different this week. Instead of looking at a few separate news hits, we’re diving into one larger issue for the week. We’re taking a look at the continued growth in the cold chain in 2024.
NTT Data, Penn State and Penske’s 2024 Third-Party Logistics Study focuses on partnerships and collaboration through data. So what does the 3PL study have to do with cold chain? Great question. Let’s get into it.
The study found that demand within the cold chain is increasing in the fresh and frozen segments. That has resulted in higher demand for cold storage warehouses as well as logistics providers to serve the space, and cold chain providers’ traditional role has evolved into something more.
Not only is demand for cold chain services increasing, but demand for related services, specifically food handling, has risen as well. The Food and Drug Administration issued new requirements for additional traceability records for certain foods. Essentially, the regulation will help transform the nation’s food safety system by shifting the focus from responding to foodborne illness to preventing it. The requirements, which take effect on Jan. 20, 2026, create new traceable Alternative Supply Sources.
This new regulation, the traceability aspect on smaller parcels and the documentation that comes with it, creates a host of other issues that cold chain providers are having to deal with before it takes effect in two years.
“At the end of the day, demand is strong and the overall environment is good, but it is not without its challenges and potential disruptors,” C. John Langley Jr., clinical professor of supply chain management in the Department of Supply Chain and Information Systems at the Pennsylvania State University, said in the study.
The role of the cold chain provider is fundamentally different from how it started. What began as ice on insulated boats and then moved into refrigeration units on trailers has now become a multibillion-dollar industry.
As a result, automation, at the warehouse level and throughout various spots of the cold chain, has become the new standard for operations. Not only does it help with warehouse efficiency, but it’s a major asset when it comes to making the most out of the labor force.
Cold storage warehouse positions are some of the hardest to fill and keep filled, which isn’t surprising when the highlight of the job is working in a freezer for 12 hours. A survey by the Global Cold Chain Alliance reports that turnover in the cold storage industry averaged 32.6% in 2019.
The warehousing industry is among the four industries with the highest worker turnover rate at 37%, with the average turnover rate across all industries at only 3.6%. According to the U.S. Bureau of Labor Statistics, an increase in warehouse job openings is seen yearly as the numbers of quits and terminations continue to rise too. The staffing issues that plague warehouses means that process improvement and automation have to be at the forefront of the conversation.
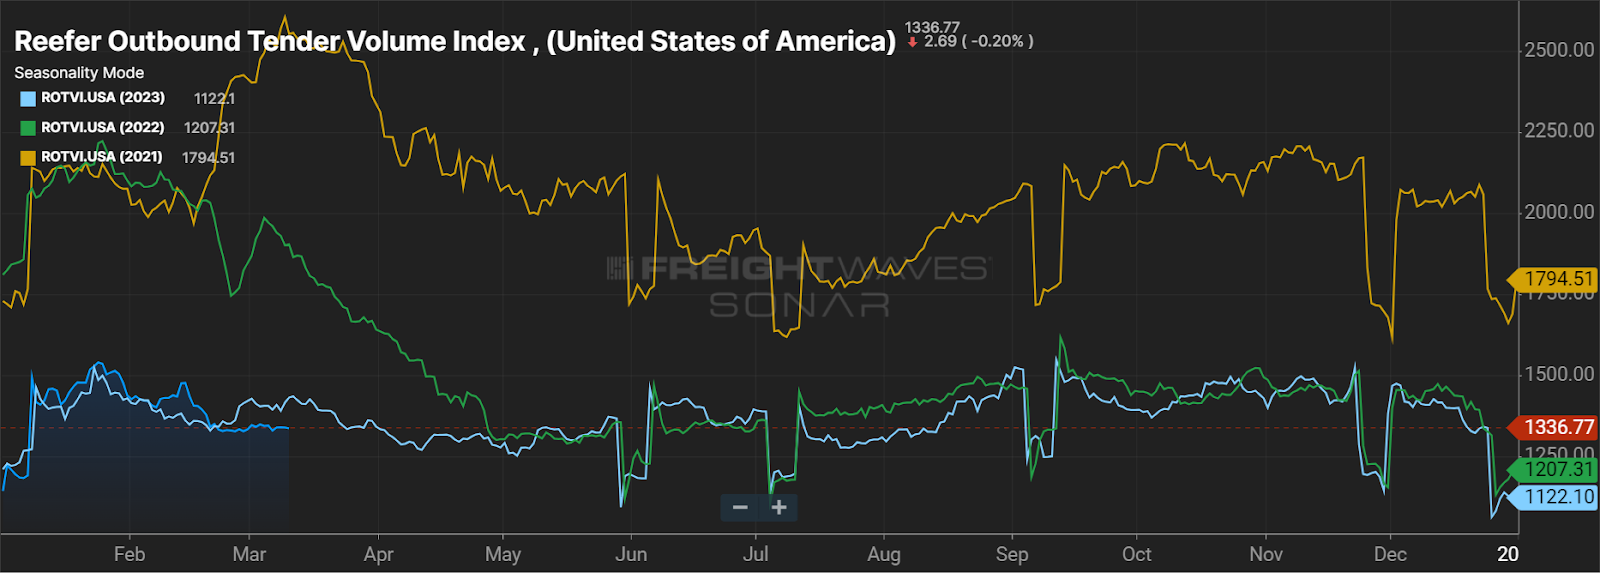
This week’s SONAR spotlight is on the Reefer Outbound Tender Volume Index, offering a glimpse into the past three years’ seasonal trends. Compared to this time last year, reefer outbound tender volumes have dipped by 6.12%. This decline is a familiar pattern that typically occurs at the onset of spring, as some protect-from-freeze freight transitions back to the dry van sector. One promising note for the start of 2024 is the minimal volatility observed in the reefer market overall, a stark contrast to the turbulence experienced in 2022. Looking ahead to the remainder of the spring, the forecast resembles March’s status quo. However, the litmus test looms at the dawn of May, when summer freight begins to take shape. As the industry braces for the impending summer surge, the market’s resilience and adaptability will be in the spotlight.
Is SONAR for you? Check it out with a demo!
Panasonic to release commercial air-to-water heat pumps using natural refrigerants for Europe
DP World announces resilient FY2023 results
Buying the food supply chain comes with income, growth, and safety
St. George to hold public hearings on housing, Cold Storage uses
Michigan trucker guilty of setting Swift Transportation trailers on fire
Wanna chat in the cooler? Shoot me an email with comments, questions or story ideas at moconnell@www.freightwaves.com.
See you on the internet.
Mary
If this newsletter was forwarded to you, you must be pretty chill. Join the coolest community in freight and subscribe for more at www.freightwaves.com/subscribe.

On episode 702 of WHAT THE TRUCK?!? Dooner is talking to Operation Livesaver’s Jennifer DeAngelis about eclipse readiness, being track-aware and freight disruptions.
Dredging Contractors of America’s William Doyle talks about the recovery and rebuilding surrounding the Key Bridge in Baltimore. How long will it take, what needs to be done and what role does dredging play in rebuilding this key connector in Charm City.
Calvin University professor Philip Johnson and students stop by to show off its supply chain program. We’ll learn all about what is offered at the university and how students are getting hands-on experience with major shippers while there.
Kinaxis’ Polly Mitchell-Guthrie lays out supply chain impacts from the Key Bridge collapse and highlights disruptions in auto and retail.
Plus; Earthquake hits the northeast; dogs in business class; commuting to work in the Arctic; changing a flat in the middle of the road.
Truck transportation jobs in March grew by the second-largest amount in the 15-month period starting in 2023 that has seen jobs in the sector decline overall, according to the monthly report by the Bureau of Labor Statistics.
The increase of 5,100 jobs also comes with a revision of the February report on truck transportation jobs that lifted that month’s total by 2,600 jobs. Additionally, the revision for January is an increase of 1,100 jobs from the most recent estimate of that month.
With those three months of rising numbers, truck transportation jobs in March were 15,800 more than reported in August of last year, when a loss of 31,600 jobs took the total down to 1,543,100 — that big decline fueled largely by the loss of employment created by the shutdown of Yellow Corp.
Overall, the weakness in the trucking industry means that the March total is 20,600 jobs less than where it was in January 2023.
Since the start of 2023, the 5,100 jobs added in March was the second-highest monthly gain, behind only the 8,000 jobs added in September. But that gain came right after the big Yellow-driven fall in jobs in August, so the 8,000 new jobs then could be viewed as at least partially a snapback after the Yellow layoffs.
“The increase in March is somewhat baffling, but the steady growth over the last 2 quarters indicates that carriers and fleets are making investments in drivers ahead of a potential flip in trucking conditions this year,” David Spencer, the vice president of market intelligence at Arrive Logistics, said in an email statement to FreightWaves. “Lower equipment prices, some relief at the pumps and a somewhat active spot market early in Q1 may be what is enabling fleets to feel comfortable with these additions.”
Spencer noted that International Roadcheck is about six weeks away. It will occur alongside what Spencer said will be the beginning of summer peak season, “and carriers are likely hoping this is when things turn.”
The March figures are for seasonally adjusted jobs, the category that most economists consider the most reliable indicator of employment levels. Not seasonally adjusted truck transportation jobs also rose, increasing to 1,532,200 from 1,526,100 in February, a number that was revised upward.
March’s report from the BLS reflected a continuation of the job purge going on at warehouses. March warehouse jobs were down 5,500, to 1,757,200, from February, though the February and January figures were revised upward.
But the net result of all the moves is that March’s total empoyment at warehouses is down by 62,300 seasonally adjusted jobs in the past year. The not seasonally adjusted total is down 57,900 jobs.
Shannon Gabriel, vice president of the Leadership Solutions Practice at TMB Consulting, noted that the logistics sector in general is going to be hit by cuts at UPS and FedEx, both of which have announced or are implementing layoffs.
She added that there is a dichotomy in the warehouse numbers: The overall levels are declining while Indeed has 105,000 active warehousing jobs listed, and some of them offer sign-on bonuses.
That is likely to result in long-term shifts, according to Gabriel.
“I expect that the market will start to stabilize due to the rise in automation,” she said. “Logistics companies are frustrated with the high turnover, rising labor costs and underqualified talent, and many will turn to automation to solve it — but we’re still a few years out from that.”
Other highlights from the report:
More articles by John Kingston
Wisconsin court affirms Amazon Flex drivers were not independent contractors
Texas trucking company employee gets over 5 years for payroll fraud
RXO gets negative outlook from Moody’s but keeps investment-grade rating